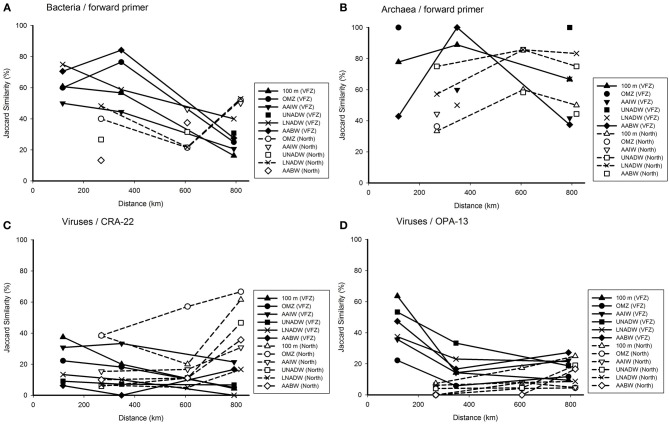
Figure 5.
Jaccard similarity plotted against the covered distance inside the VFZ as compared to the northern section, depicting alterations in the bacterial (A), archaeal (B), and viral (C,D) communities. Each symbol represents the similarity of the community in the corresponding water mass to the previous station.

