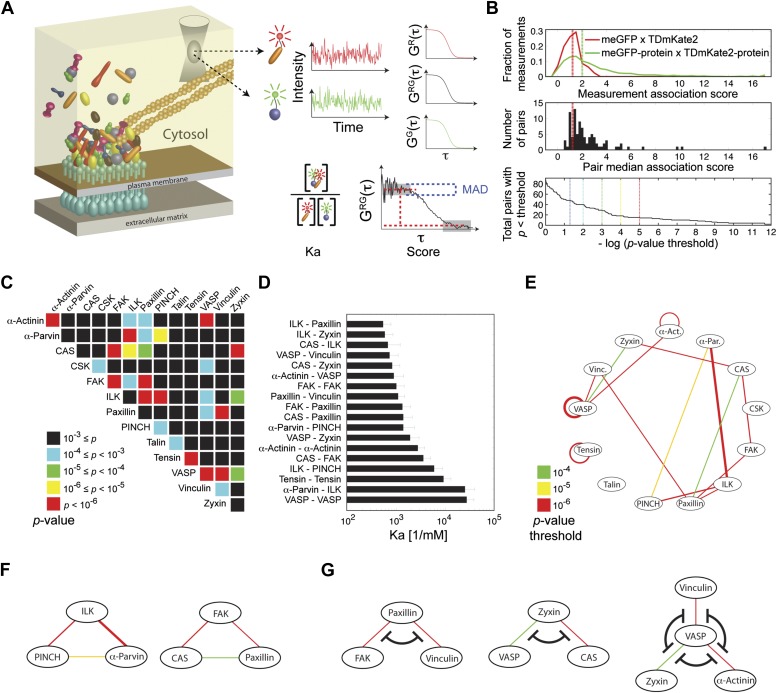
Figure 1. Extensive physical associations between components of cell-matrix adhesion sites in the cytosol.
(A) Pairwise physical associations between proteins tagged with meGFP and TDmKate2 were measured in the cytosol of REF52 and NIH3T3 cells using FCCS (schematized). From these measurements the apparent association constants (Ka) and the association scores were derived as described. (B) Top, area-normalized distributions of association scores between meGFP and TDmKate2 alone (i.e., negative control, n = 126 cells, red line) and between the different analyzed components of adhesion sites in all individual valid measurements performed in REF52 cells (n = 1914 cells; green line) with their corresponding medians (vertical lines). Middle, the distribution of median association score of the 91 protein pairs (60 ≥ n ≥ 9 cells per each pair). Red line indicates the median association score of the negative control. Bottom, the total number of pairs with a median association score bigger than that of the negative control at different statistical confidences (Supplementary file 1). The p-values indicate the probability that the observed median association score of a given pair is bigger than that of the negative control by coincidence. Thus a higher −log(p-value threshold) value means a higher statistical confidence for physical association. (C) A heatmap indicating the p-value of each protein pair in REF52 cells. (D) A bar plot showing the median ± median absolute deviation (MAD) Ka for protein pairs having p-value <0.0001 (n ≥ 13 cells per pair). (E) The network of physical associations between the analyzed proteins. Shown edges are those having p-value <0.0001 in REF52 and p-value <0.02 in NIH3T3 (Supplementary file 1). Edges color and width indicate p-value categories as in (C) and proportionally Ka in REF52, respectively. (F) Based on the network shown in (E), two potential ternary complexes are indicated. (G) Mutually exclusive physical associations inferred from (D) and (E) as cases in which two or more proteins exhibit pairwise associations with another protein but not between themselves.


