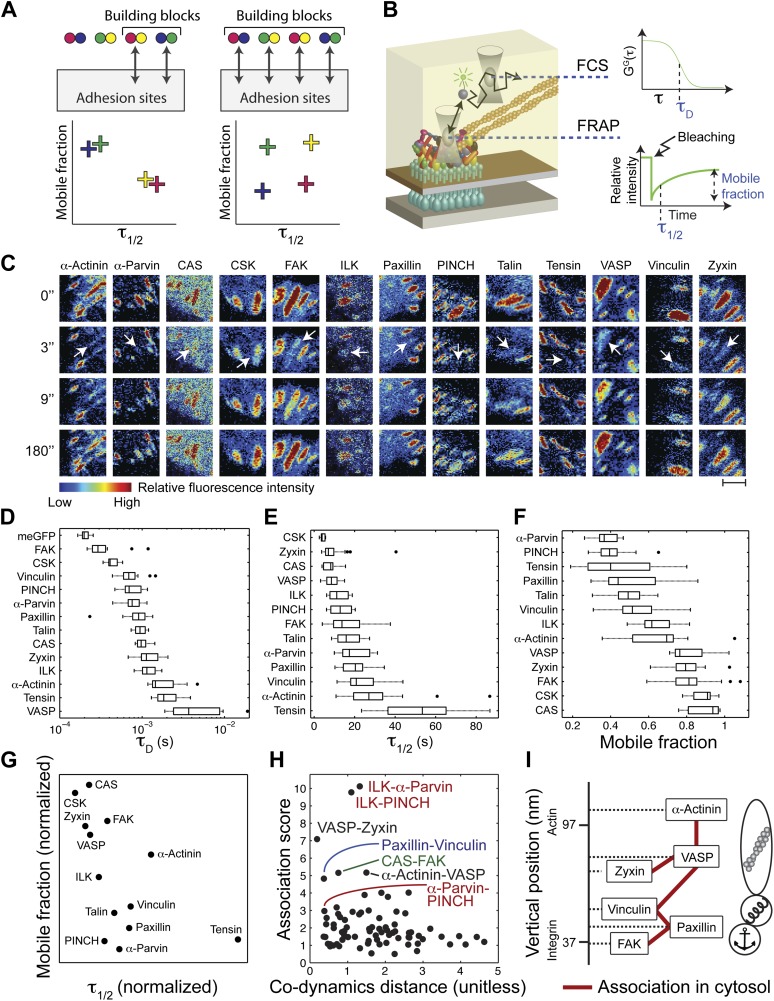
Figure 2. The cytosolic building blocks of cell-matrix adhesion sites are combinatorially diversified.
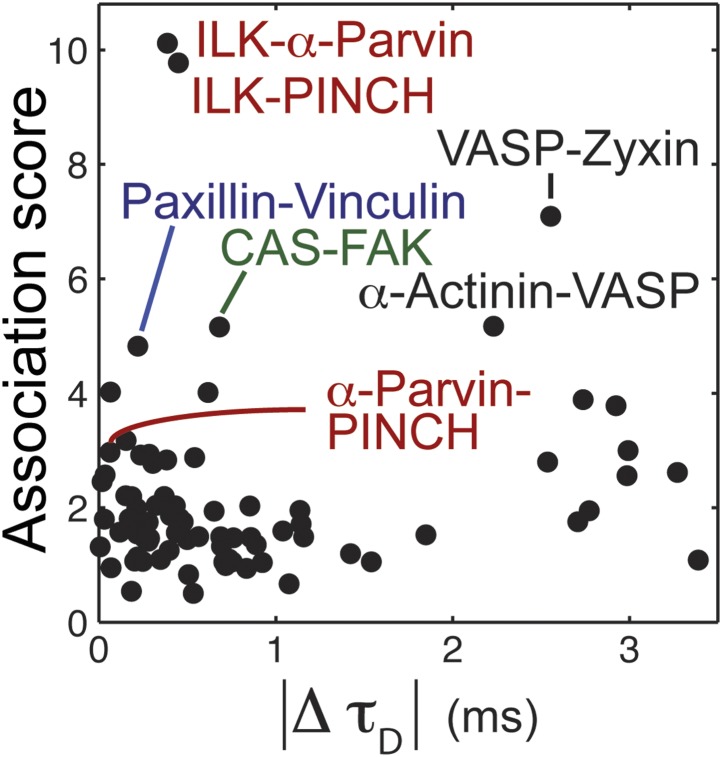
(A) Not all cytosolic integrin-adhesome complexes are necessarily building blocks for adhesion sites. If each protein is in only one type of building blocks then physically associated proteins should exhibit the same dwell times (τ1/2) and mobile fractions in focal adhesions. (B) REF52 cells expressing the analyzed proteins tagged with meGFP were measured using FRAP and FCS to quantify their τ1/2 and mobile fractions in focal adhesions and their dwell times in a confocal volume in the cytosol (τD). (C) Example FRAP images before (0″) and after bleaching a focal adhesion (arrows). Scale bar, 5 μm. (D–F) Box plots of the τD (26 ≥ n ≥ 14 cells), τ1/2 and mobile fractions (31 ≥ n ≥ 7 cells) of each protein. (G) Median τ1/2 vs median mobile fraction of each protein normalized to zero-mean and unit-variance. Thus, in this plot the Euclidean distance (co-dynamics distance) between proteins quantifies the difference in their dynamics. (H) The co-dynamics distance vs median association score of all possible 78 heteromeric protein pairs. (I) The reported vertical distance from substrate of 6 of the analyzed components across focal adhesions (Kanchanawong et al., 2010) and the cytosolic associations between them as measured here (Figure 1E). Anchor, spring, and actin symbols indicate vertical layers of integrin signalling, mechanosensing and actin regulation across focal adhesions, respectively (Kanchanawong et al., 2010).


