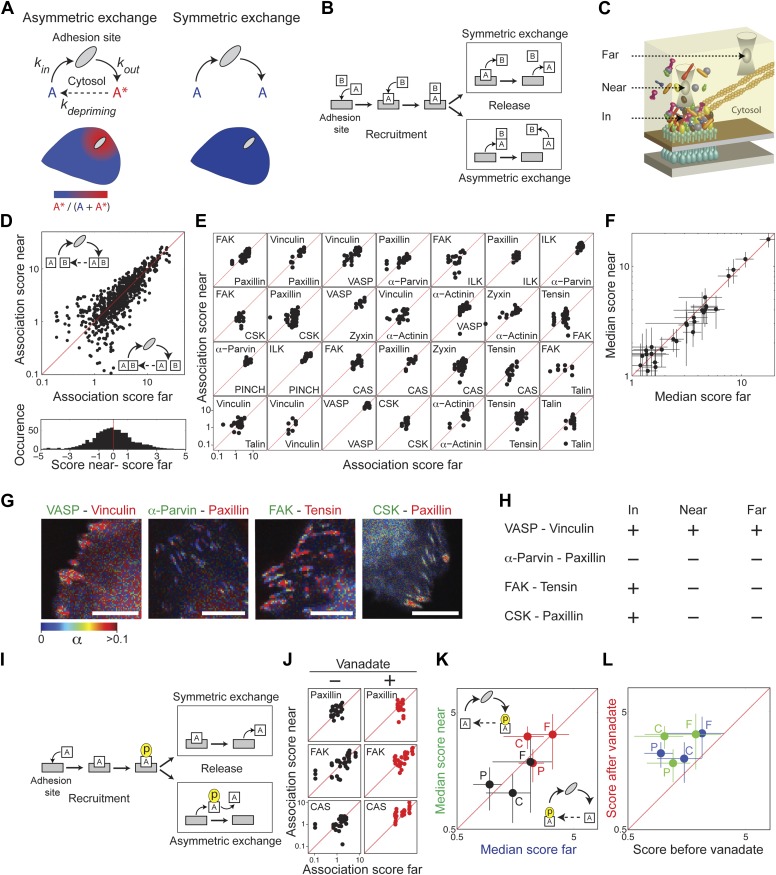
Figure 3. Symmetric material exchange between stationary focal adhesions and cytosol.
(A) The symmetric and asymmetric models of material exchange between adhesion sites and cytosol. In symmetric exchange a component, A, exits from adhesion site in the same state it had upon entering to it. In asymmetric exchange A exits in a different, primed state A* and relaxes back to state A in the cytosol, thereby generating a spatial gradient of the primed state emanating from adhesion sites. (B) Formulation of the two models for the case in which priming (of A) is based on interaction (with protein B). Here, asymmetric exchange would generate a spatial gradient of AB complex concentration emanating from adhesion sites. (C–F) Discriminating between the two models by measuring the physical associations near (<1.5 μm) and far from focal adhesions for 28 protein pairs as named in (E). Scatter plots compare the association scores near vs far from focal adhesions for all the 28 pairs together (n = 755 focal adhesions) (D), for each pair separately (n ≥ 9) (E) or for the median score of each pair ± MAD (F). Data-points far from the equality diagonals (dashed red lines) would correspond to asymmetric exchanges, as illustrated in (D), while data-points along the diagonal indicate symmetric exchange. Histogram in (D) shows the distribution of the difference in association scores near and far from focal adhesions. (G) FLIM images color-coding the fraction, α, of donor- (mCitrine-) tagged protein (green) that FRETs to the acceptor- (mCherry-) tagged protein (red) for four protein pairs. Scale bars, 10 μm. (H) Comparison of the interaction states of the four protein pairs shown in (G) in focal adhesions with their physical associations near and far from focal adhesions. (I) Formulation of the symmetric and asymmetric models for the case in which priming is based on phosphorylation. (J–L) Scatter plots comparing the association scores of meGFP-dSH2 with paxillin, FAK, and CAS (denoted P, F, and C, respectively) near vs far from focal adhesions (green and blue, respectively) and before vs after vanadate treatment (black and red, respectively). Error bars indicate MAD (n ≥23 focal adhesions).


