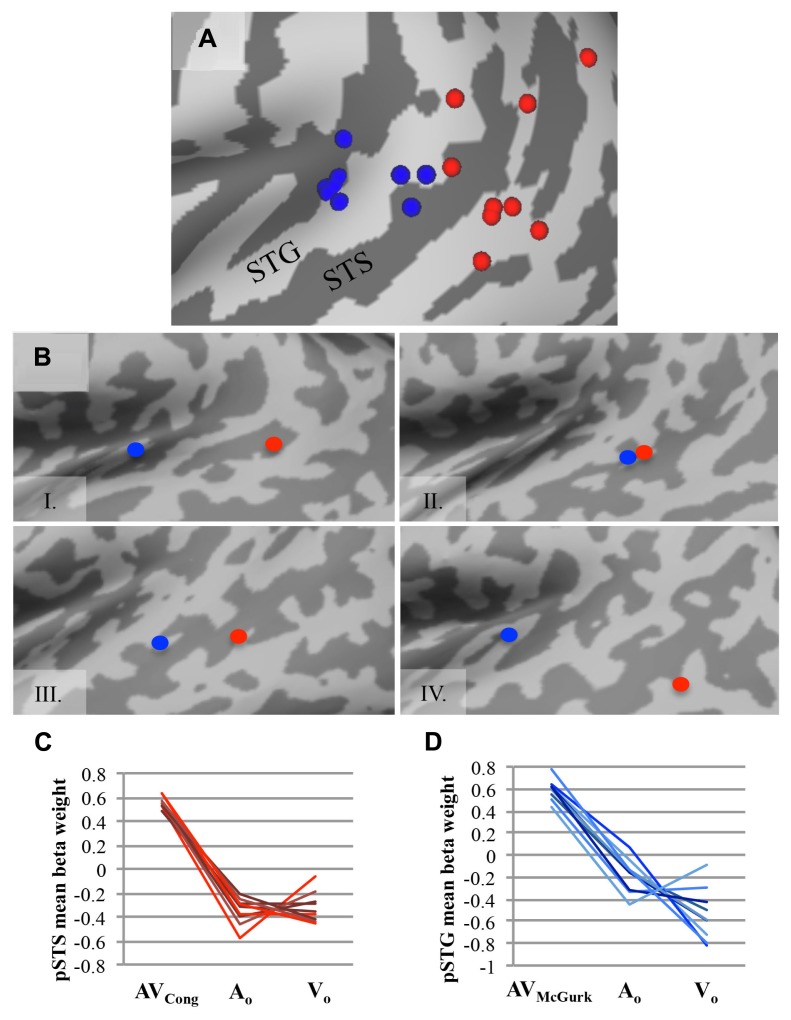
FIGURE 2.
AV speech areas for congruent and McGurk speech in the left posterior superior temporal cortex: consistency across single subjects. (A) The center of gravity for clusters with significantly greater fMRI signal for AV trials than for both types of unimodal trials (AV > AO ∩ AV > VO) are plotted for each participant on an inflated template cortical surface (single-voxel threshold t > 2.2461, p < 0.025). Although the functional location varies, nine out of ten participants exhibited a significant AV effect for AVCong speech in the left pSTS region (red), and all participants but one exhibited significant AV effects for AVMcGurk speech in the left pSTG region (blue). (B) Four representative single-subject cortical surface maps are displayed with each participant’s foci projected on the inflated surface. Foci represent the center of gravity for clusters with significantly greater fMRI signal for AV speech compared to unimodal speech (AV > AO ∩ AV > VO). Red dots represent AVCong speech, and blue dots represent AVMcGurk speech. In most participants, the congruent AV speech clusters were located more posteriorly compared to the McGurk speech clusters. For (A) and (B), only the left posterior superior temporal cortex (also including lateral fissure) is displayed. (C,D) For each participant, mean fMRI signal from each cluster, estimated by mean beta weight and identified from single-subject activation maps, is depicted for AV and unimodal trials in the left pSTS region (C) and the left pSTG region (D); each line represents a single participant. Abbreviations as in Figure 1.

