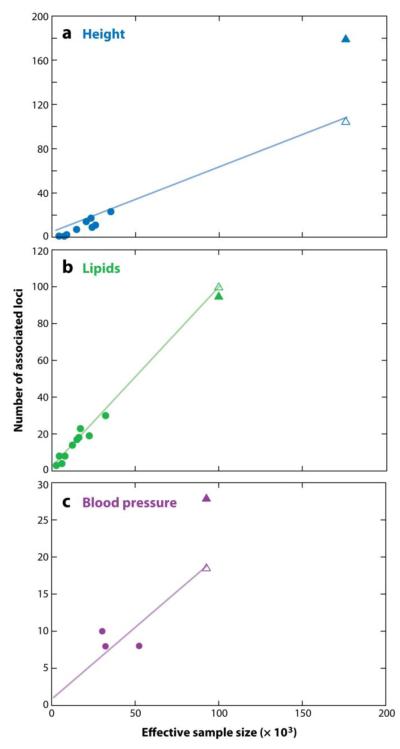
Figure 2.
The effective sample size (see text for details) is plotted against the number of loci reaching genome wide significance for genome-wide association studies for height (top), the combination of three lipid traits (middle; HDL-cholesterol, LDL-cholesterol, and triglycerides), and the combination of two blood pressure traits (bottom; systolic and diastolic blood pressure). In each case, the largest study is removed, and a line through the origin is fitted to the remaining studies (circles). The number of loci in the largest study (filled triangle) is greater than or equal to that predicted by extrapolating the line to the effective sample size of the largest study (open triangle).

