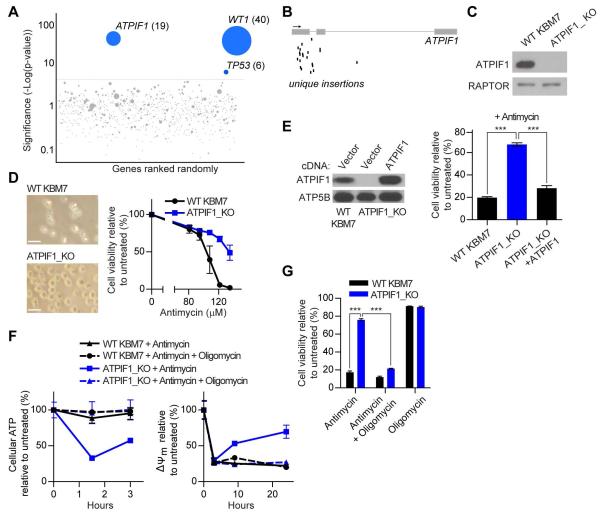
Figure 1. Haploid genetic screen identifies loss of ATPIF1 as protective against complex III inhibition.
(A) Mutagenized KBM7 cells were treated with antimycin and resistant cells were pooled. Gene-trap insertions were identified by massively parallel sequencing and mapped to the human genome. The y-axis represents the statistical significance of a given gene, while the x-axis represents the collection of genes with insertions. The red line indicates the cut-off of statistical significance chosen to determine whether a gene scored as a hit in the screen. For ATPIF1, WT1, and TP53, the number of unique insertions per gene is given in parentheses. (B) Map of unique insertions in ATPIF1 in the resistant cell population. The arrow denotes 5′-3′ directionality, boxes represent exons, and black bars indicate insertions. (C) Immunoblots for indicated proteins in WT and ATPIF1_KO KBM7 cells. (D) Micrographs (left) and viability (right) of WT and ATPIF1_KO KBM7 cells treated with antimycin for 4 days. Error bars are ± s.e.m. (n = 3). Scale bars, 20 μm. (E) Immunoblots for indicated proteins in WT, ATPIF1_KO, and ATPIF1_KO KBM7 cells with restored ATPIF1 expression (left) and viability of cells treated with antimycin (135 μM) for 2 days (right). Error bars are ± s.e.m. (n = 3). ***P < 0.001. (F) Cellular ATP (left) and ΔΨm (right) in WT and ATPIF1_KO KBM7 cells treated with antimycin (135 μM) and oligomycin (1 μM). Error bars are ± s.e.m. (n = 3). (G) Viability of WT and ATPIF1_KO KBM7 cells treated with antimycin (135 μM) and oligomycin (1 μM) for 2 days. Error bars are ± s.e.m. (n = 3). ***P < 0.001. See also Figures S1, S2, S3, and Table S1.

