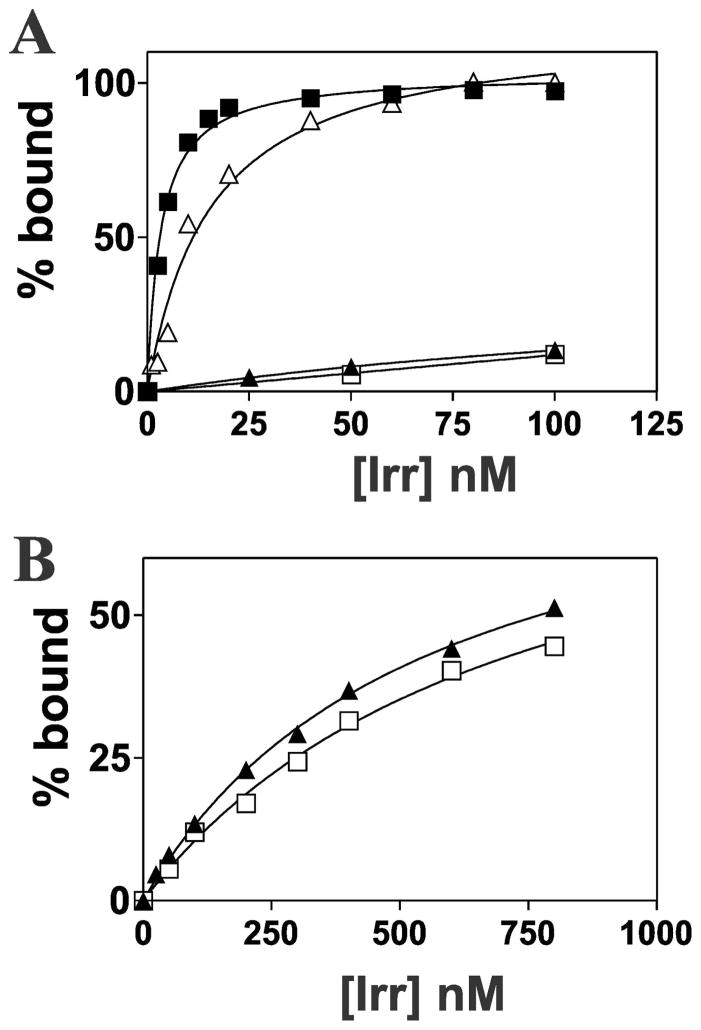
Fig. 2.
Analysis of Irr-binding to the promoters of Irr-regulated genes. (A) EMSA was carried out using 0.1 nM 32P-labelled promoter DNA of bfr (closed squares), fhuE (closed triangles), PfhuE/ICEbfr (open triangles) and Pbfr/ICEfhuE (open squares) titrated with various concentrations of Irr. Bound and unbound DNA was resolved on a 5% non-denaturing polyacrylamide gel and visualized by autoradiography. Autoradiographs were scanned, and bands were quantified to determine bound and unbound DNA. (B) Binding curves of fhuE (closed triangles) and Pbfr/ICEfhuE (open squares) at higher Irr concentrations.

