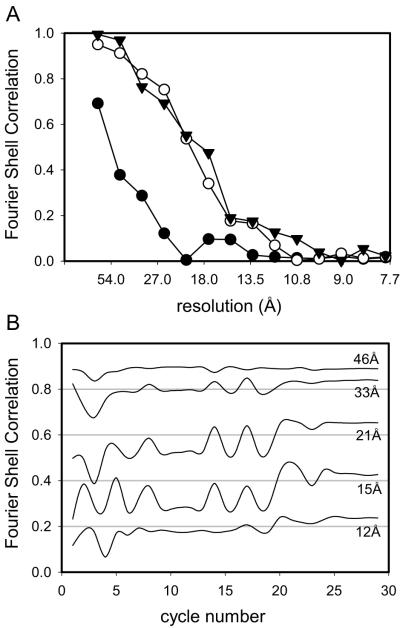
Figure 7.
Fourier Shell Correlation of scallop Ca2+-ATPase reconstructions. (a) FSC determined by comparing two independent IHRSR reconstructions of scallop Ca2+-ATPase. For the triangles, the correct helical symmetry was used to create the initial reference and to search for helical parameters throughout the refinement. For the circles, the reference was made with an incorrect symmetry and refinement proceeded near either the correct symmetry (open circles) or the incorrect symmetry (filled circles). (b) FSC plotted in resolution shells as a function of refinement round for a single tube. This plot facilitates tracking of the refinement and shows that the algorithm converged after ~25 rounds. This particular tube was refined with the correct symmetry and corresponds to the triangles in (a).

