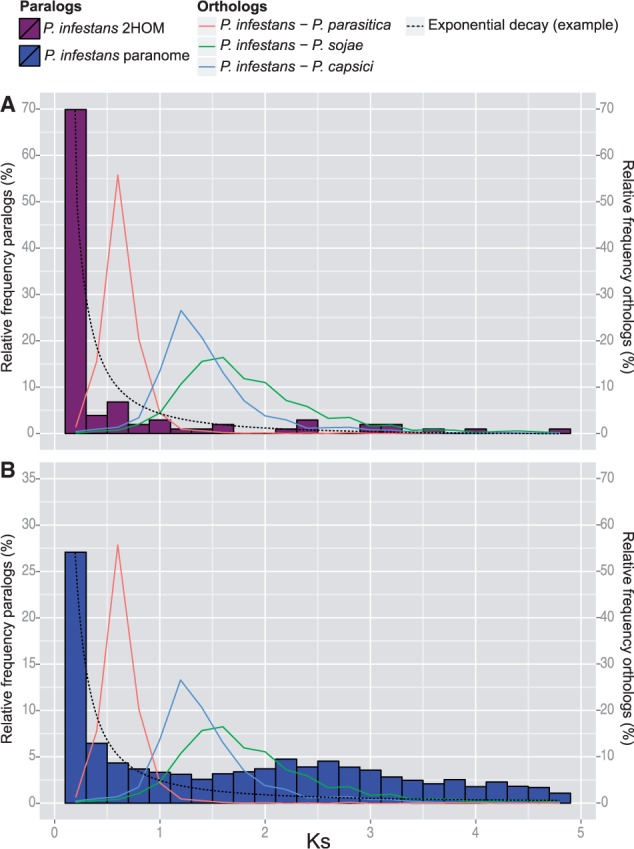
Fig. 3.—

Ks distributions of Phytophthora infestans. (A) 2HOM block paralogs and (B) full paranome. Peaks in the distributions of orthologous sets of gene pairs indicate speciation events. Dashed lines indicate examples of distributions following a pattern of exponential decay. Full paranome distributions of the other Phytophthora spp. are available in supplementary figure S1, Supplementary Material online.
