
Fig. 2.—
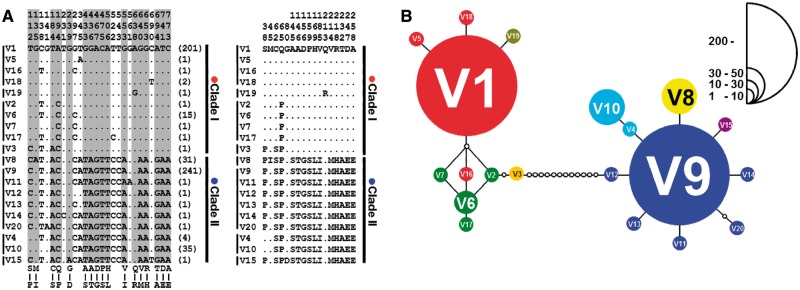
Dimorphic diversity of V1R2 in LV cichlids. (A) Nucleotide (left) and amino acid (right) sequence alignment. Dots indicate sites that are identical to the top sequence (V1 allele). The number of times each sequence was identified is shown in parentheses. Alleles with identical amino acid sequences are grouped with a vertical line. (B) Network tree of the V1R2 alleles. Each circle represents an allele described in panel (A). The size of the circle is proportional to the allele frequency (scale is indicated). Alleles with identical amino acid sequences are shown in the same color. Hypothetical alleles, which serve as connectors between observed alleles, are represented by white circles.