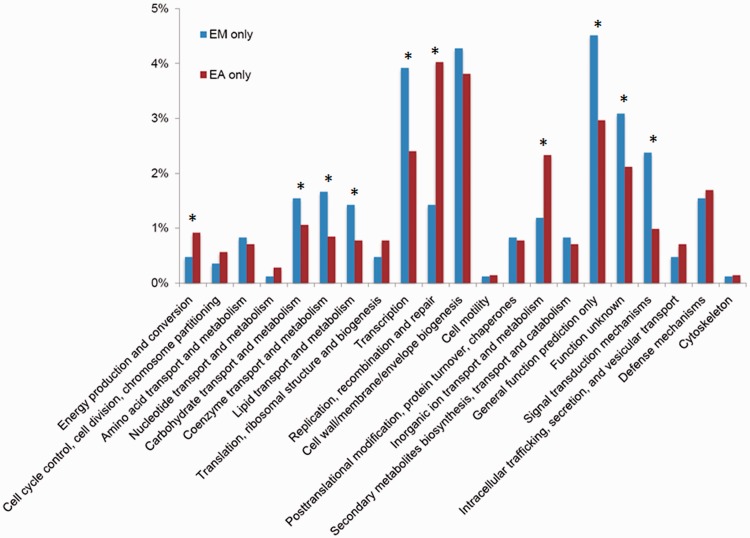
Fig. 5.—
The identified EM-only and EA-only proteins were assigned to Clusters of Orthologous Groups (COGs). The y axis indicates the percentage of genes in a specific function cluster out of the total numbers of EM-only and EA-only proteins, respectively. *The abundances of specific function clusters were compared statistically as described in Rodriguez-Brito et al. (2006) and Allen et al. (2009) using a subsample size of 500 and 1,000 bootstrap replicates at a statistical confidence of 99%.

