
Fig. 1.—
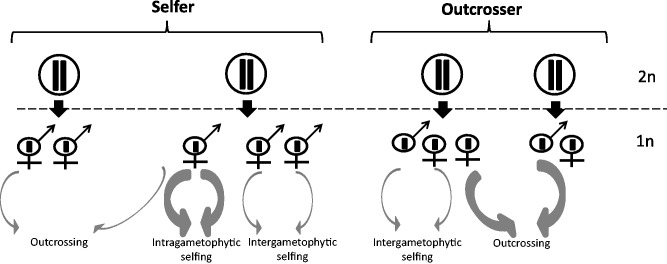
Schematic representation of the mating system of selfer and outcrosser organisms with a haploid-dominant life cycle. Solid black arrows refer to meiotic events and the dashed horizontal line separates the haploid and diploid phases. Thickness of the gray arrows indicates the relative frequency of selfing and outcrossing events in selfers and outcrossers.