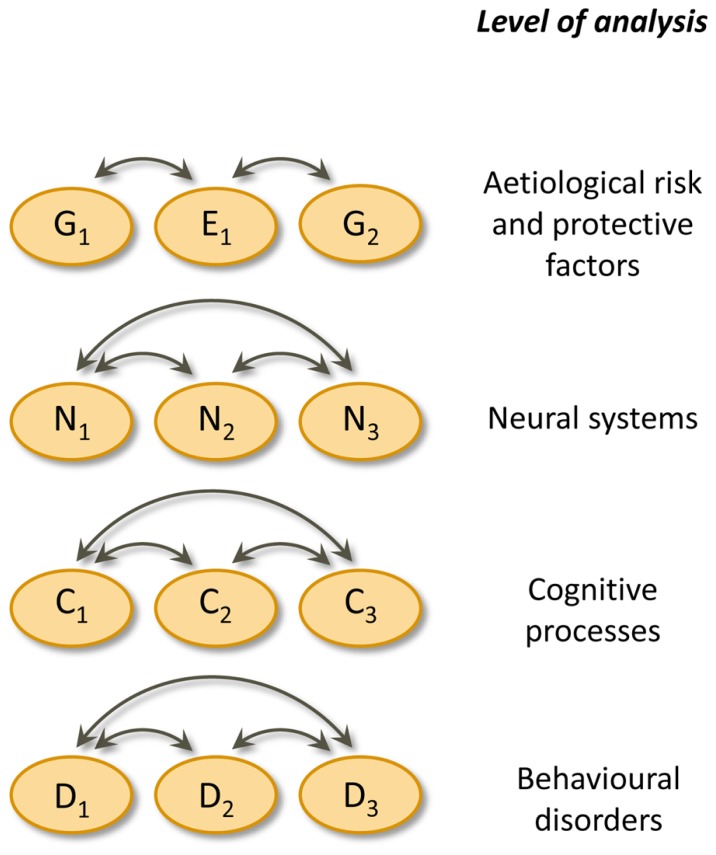
FIGURE 1.
Pennington’s multiple deficit model. Double headed arrows indicate interactions. Causal connections between levels of analysis are omitted. G = genetic risk or protective factor, E = environmental risk or protective factor, N = neural system, C = cognitive process, D = complex behavioural disorder.

