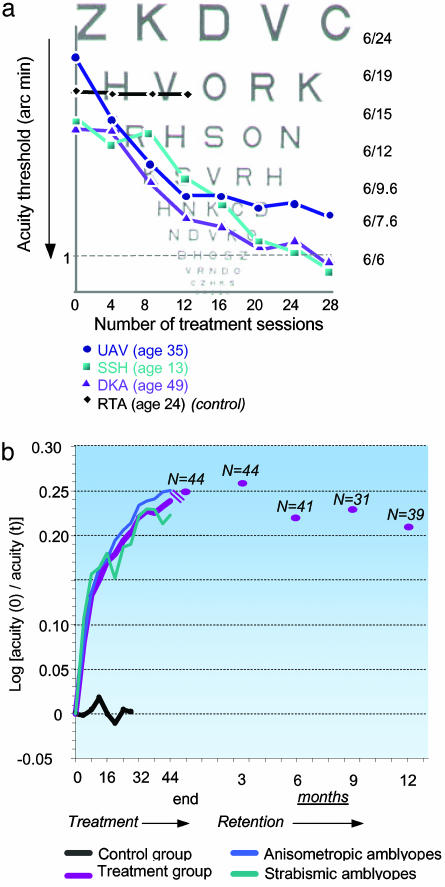
Fig. 4.
Learning curves. (a) VA learning curves for three amblyopic patients and one control subject (RTA). Whereas the patients going through the training schedule showed a marked improvement in VA, the control subject, practicing with only highly discriminable (high-contrast) targets, showed no improvement. The actual chart, viewed at 3 m, has measured letters that are ≈7.3 times larger than the chart shown. (b) VA learning curves: group data (two treatment groups, n = 63; control group, n = 14). A relatively rapid improvement in VA during the first eight sessions is followed by a phase of slower learning. Learning seems to occur at the same rate for anisometropic amblyopic patients (n = 32) and strabismic amblyopic patients (n = 14). Testing of retention after 3 (n = 44), 6 (n = 41), 9 (n = 31), and 12 (n = 39) months disclosed only a slight decrement of performance.

