
Figure 17.
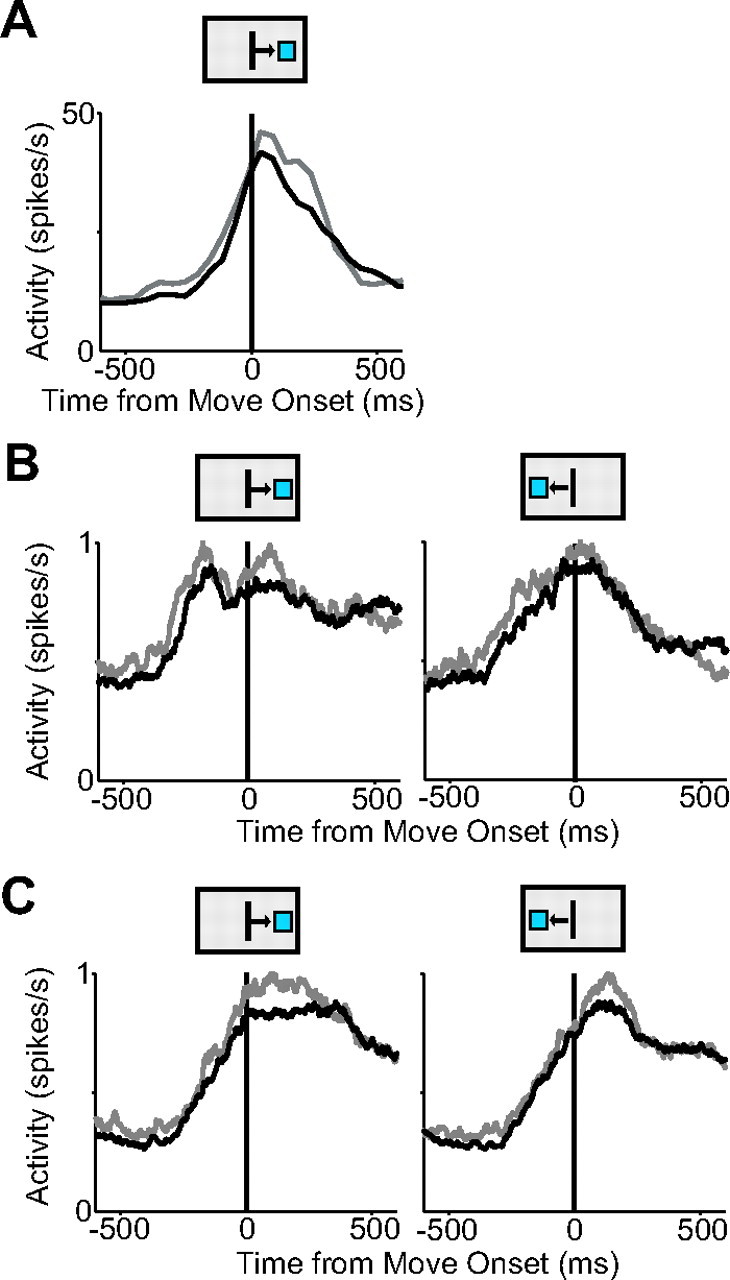
Pre-SMA and SMA movement activity modified by high and low reward. A, Activity for single SMA cell on high-reward (gray) and low-reward (black) trials. B, Mean spike density functions of all pre-SMA movement cells under high (gray)- and low (black)-reward conditions. C, Mean spike density functions for SMA movement cells. The movement direction is indicated by the boxes above the plots.