
Figure 2.
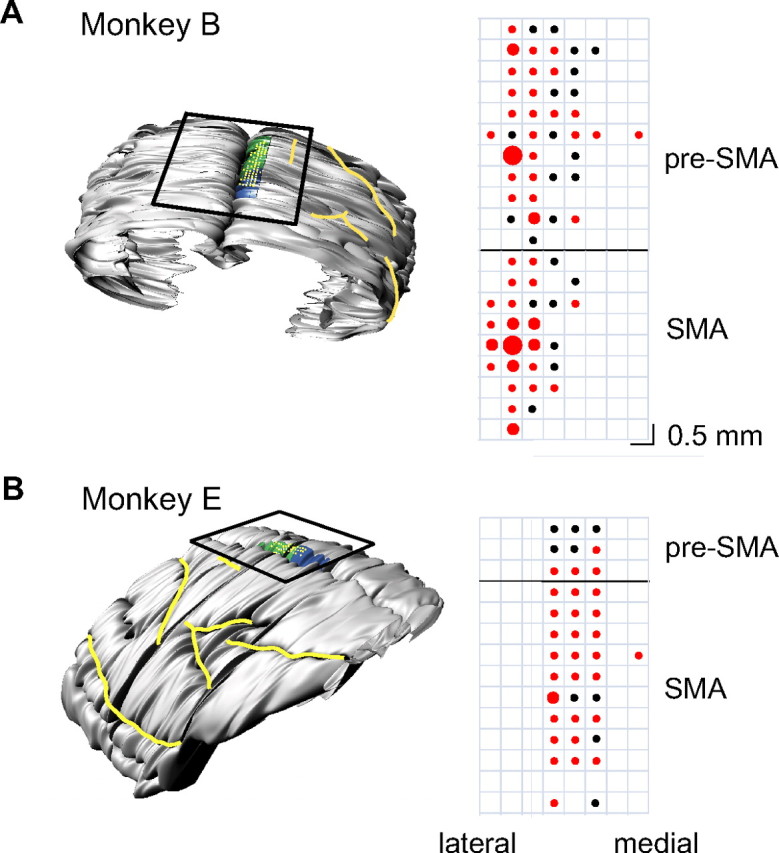
Localization of recording sites. A, A model of the brain for monkey B constructed from MRI slices showing the pre-SMA region highlighted in blue and the SMA region highlighted in green (left). Major sulci are outlined in yellow. The black box indicates the location of the recording chamber, and the yellow grid indicates the recording sites. A magnified version of the recording grid is shown to the right. The red circles indicate the position of movement-related neurons. The circle sizes indicate the number of neurons (large, 9–12 cells; medium, 5–8 cells; small, 1–4 cells). Penetrations that yielded no movement-related neurons are indicated by black dots. The horizontal black line indicates the location of the branch of the arcuate sulcus. B, Chamber location and recording sites from monkey E.