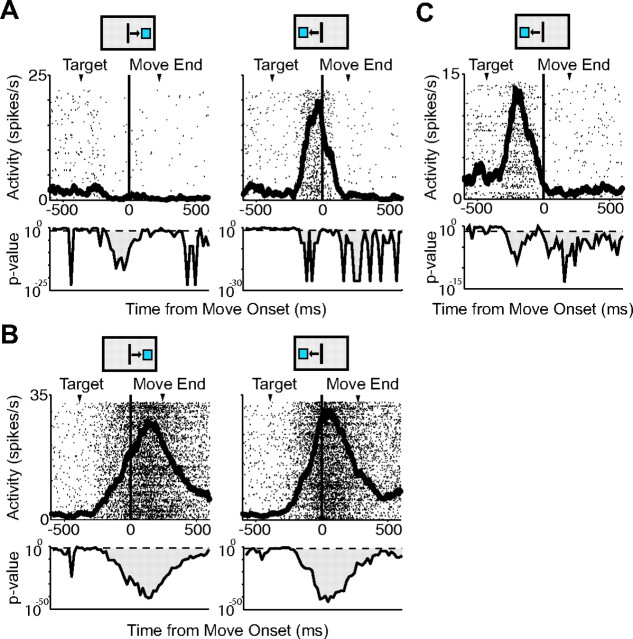
Figure 4.
Movement-related cells. A, Spike density function for a movement-related cell from the SMA active for movements to the right target, but not for movements to the left target. Spike density functions are shown overlaying raster plots. Results of t tests performed on movement-related activity compared with baseline activity in 20 ms intervals are shown below each spike density function. The dotted horizontal line indicates p = 0.05 boundary. B, Movement-related cell from the SMA with bidirectional activity. C, Spike density function for a pre-SMA cell showing early-onset activity. The arrowheads mark the average time of target onset and movement end. The black box above each plot indicates the movement direction.

