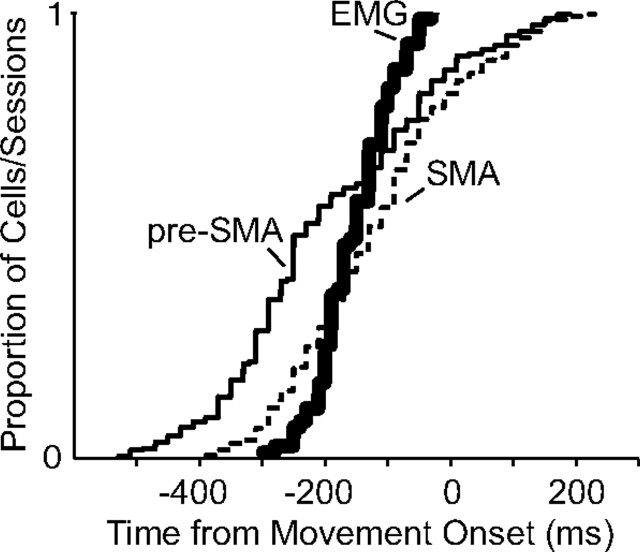
Figure 9.
Onset time distribution of neural and muscle activity. The thin solid line indicates onset times of movement-related pre-SMA neurons (mean, 245 ms before movement onset). The thin dashed line indicates onset times of movement-related SMA neurons (mean, 188 ms before movement onset). The thick line indicates onset times of all muscles (mean, 154 ms before movement onset).

