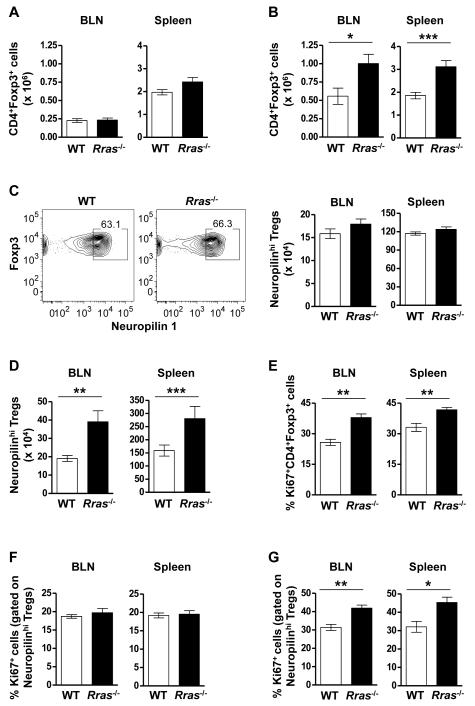
Figure 5. Enhanced proliferation of leads to increased numbers of nTreg in the BLN and spleen of Rras−/− mice during EAE.
A,B, The absolute number of CD4+Foxp3+ cells in the BLN (left panel) and spleen (right panel) of WT and Rras−/− mice when naïve (A) or 17 days after EAE induction (as for Fig. 1) (B) is shown. Data shown are the mean ± SE of pooled data from three to four independent experiments with 8-12 mice in each group. C,D, The percentage (C, left panel) and absolute number (C, right panel and D) of CD4+Foxp3+ cells expressing high levels of Neuropilin-1 (Neuropilinhi) was determined in the spleen (C, left and right panel and D) and the BLN (C, right panel and D) in WT and Rras−/− naïve mice (C) and 17 days after EAE induction (D). Data shown are the mean ± SE of pooled data from two to three independent experiments with 6-10 mice in each group. E,G) The proliferation of CD4+Foxp3+ (E) and CD4+Foxp3+ Neuropilinhi (F,G) cells was determined by Ki67 expression in WT and Rras−/− naïve mice (F) and 17 days after EAE induction (E,G). Data shown are the mean ± SE of pooled data from two independent experiments with 6-7 mice in each group. *p<0.05, **p<0.01, ***p<0.001.

