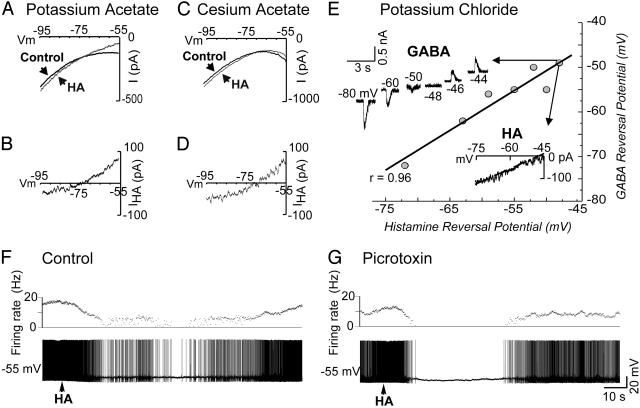
Fig. 2.
Voltage characteristics of the ionic responses to HA in PGN neurons recorded with electrodes loaded with potassium acetate, cesium acetate, or potassium chloride by using single-electrode voltage clamp. (A) Current versus voltage (I-V) plot before and during the response to HA obtained with a neuron recorded with an electrode loaded with 2 M potassium acetate. (B) Subtracting control trace from HA trace reveals the voltage dependence of the HA-induced current and its reversal potential, which averaged -72.8 ± 8.5 mV (SD, n = 8) across neurons. (C) I-V plot before and during the response to HA obtained with a neuron recorded with 3 M cesium-acetate-filled electrodes. (D) Subtracting control traces from HA traces reveals the voltage dependence of the currents and their reversal potential with a current that reversed on average at -74.6 ± 3.4 mV across neurons. (E) Plot of reversal potentials for GABA and HA when the cells were recorded with 3 M potassium-chloride-filled electrodes. Application of GABA to voltage-clamped neurons under these circumstances resulted in an outward current that reversed at potentials varying from -72 mV to -49 mV, indicating that a variable positive shift in ECl had occurred. In these conditions, application of HA to the same neurons also resulted in an outward current that reversed at potentials from -72 mV to -48 mV. A linear regression analysis of the reversal potentials of GABA versus HA showed a correlation coefficient of 0.96 (P < 0.001). Each point represents a different PGN cell. (F and G) The inhibitory response to HA is not antagonized by block of the GABAA ionophore with the bath application of picrotoxin (20 μM).

