Fig. 1.
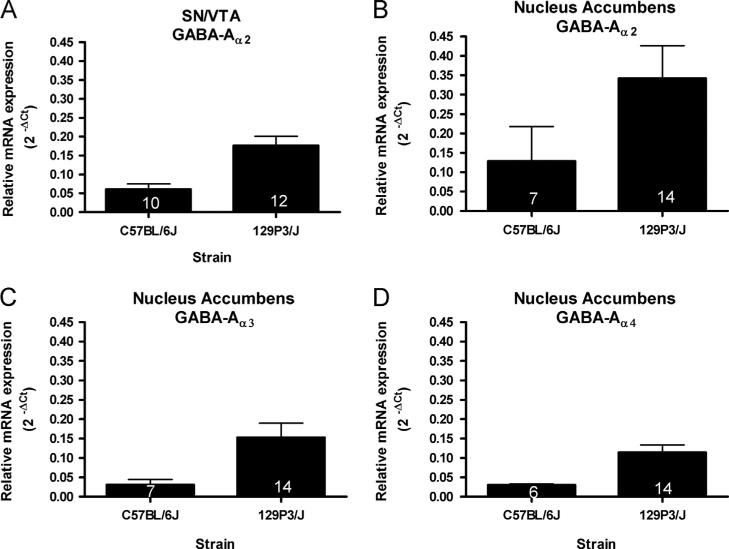
Region-specific strain differences in the levels of GABA-A receptor subunits mRNA. (A) GABA-Aα2 mRNA expression in the SN/VTA was higher in 129 mice than in C57 animals (t(20)=3.836, p<0.001). B) GABA-Aα2 mRNA levels were higher in the NAc of 129 compared to C57 mice (U=12.00, p<0.005). C) Levels of GABA-Aα3 mRNA were higher in the NAc of 129 compared to C57 mice (t(19)=2.273, p<0.05). D) GABA-Aα4 mRNA expression in the SN/VTA was higher in 129 mice than in C57 animals (t(18)=2.780, p<0.05). The number of animals in each group is indicated within each bar.

