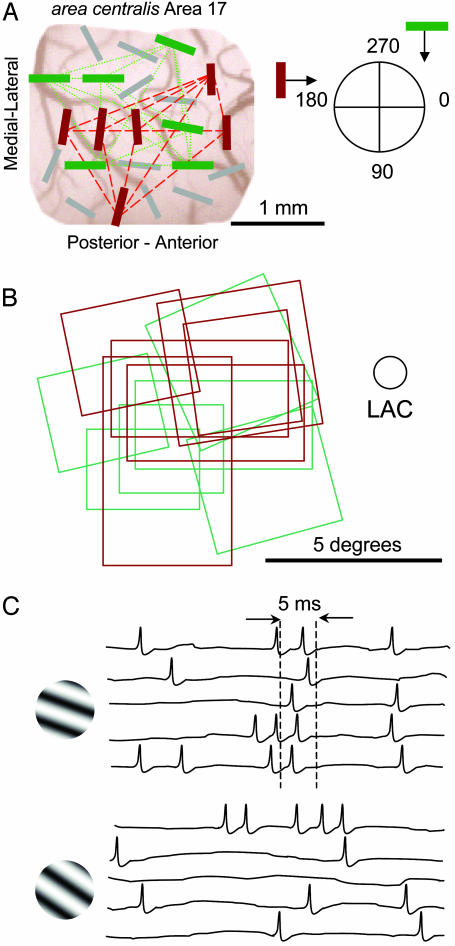
Fig. 1.
(A) A map of a microelectrode array recording session (cortex viewed from above). The bars represent the preferred orientation (drifting in the direction of the arrow) of the cell recorded at each electrode location. The dashed and dotted lines represent moderate synchronization when activated by a drifting sinusoid grating at the preferred orientation (red: 180°; green: 270°). (B) Receptive field plots for the two assemblies described above (corresponding colors). LAC, left area centralis. (C) An example of 100-ms responses from another recording session from 5 cells to 20° (Upper) and 34° (Lower) orientated drifting gratings.

