
Figure 3.
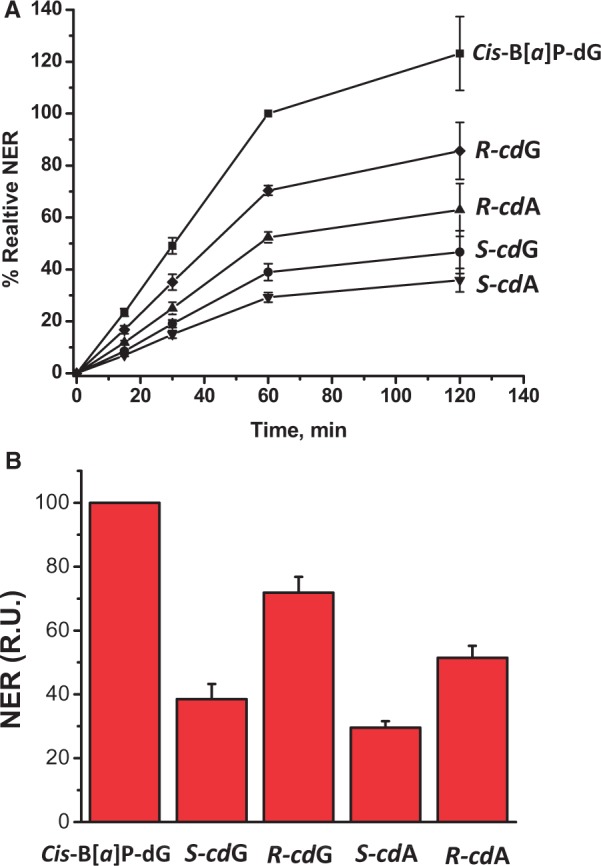
(A) Time course of NER dual incision product formation of 24–32 oligonucleotide fragments bearing either the cis-B[a]P-dG, 5′R–cdG, 5′R–cdA, 5′S–cdG or 5′S–cdA lesions. The experimental data points are averages of five independent experiments in different cell extracts, and the error bars represent the standard deviations. The incision efficiencies of the cdG- and cdA-containing sequences were normalized in each of the five independent experiments to the value obtained with cis-B[a]P-dG (relative value of 100 at the 60-min time point, also determined in each experiment). The results are thus provided in relative units (RU). The reaction kinetics are linear up to at least 60 min incubation times, and rates of reaction level off within the 60–120-min time interval. (B) Relative initial rates of dual incision kinetics determined by averaging the slopes of the straight line portions of the data obtained with the ODN(1) duplex (panel A), and the analogous plot obtained with the ODN(2) duplex (Supplementary Figure S3). The results obtained with the ODN(1) and ODN(2) duplexes were the same within experimental error (Supplementary Figure S3), and the 17-mer sequence contexts in which the cyclopurine lesions are embedded, are identical in ODN(1) and ODN(2).