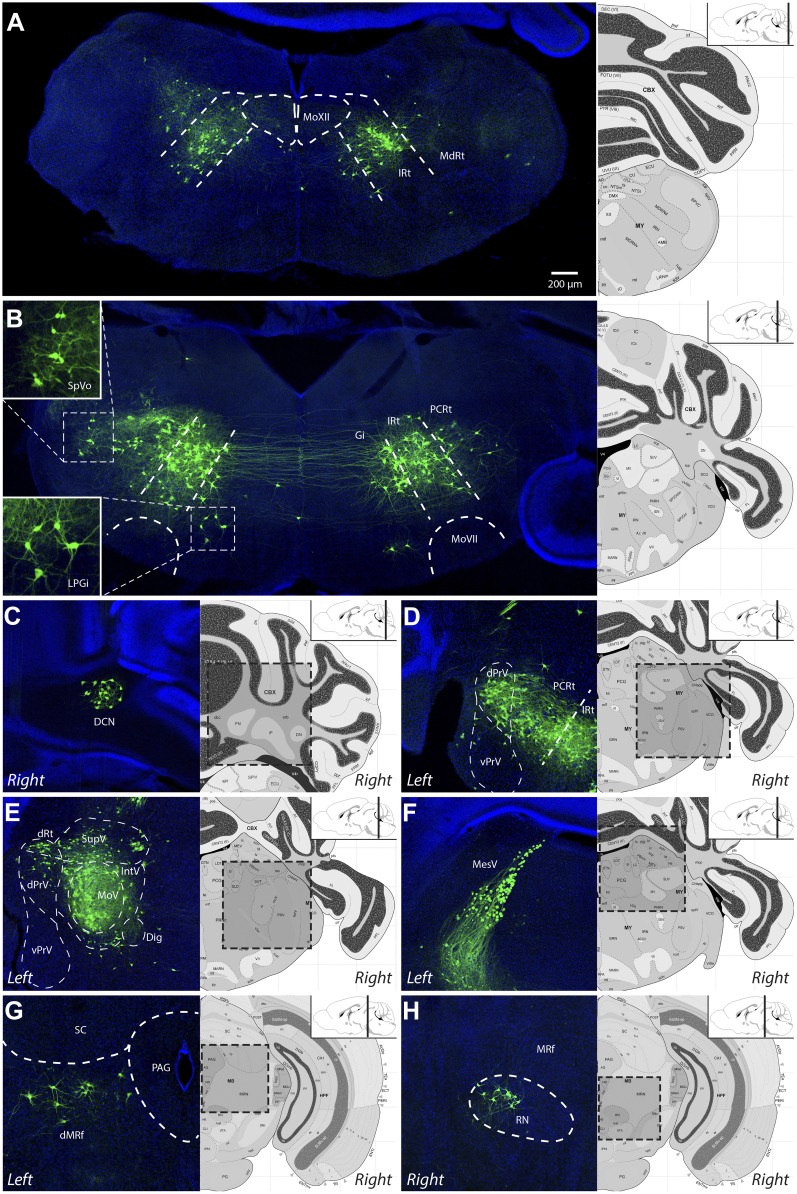
Figure 2. Representative images of labeled jaw premotor neurons after ΔG-RV injection into the left masseter muscle.
(A) Caudal brainstem showed labeling primarily in the caudal intermediate reticular formation (IRt-c) and medullary reticular formation (MdRt). (B) Rostral brainstem at the level of the facial motor nucleus (MoVII) showed extensive labeling in the rostral IRt (IRt-r) and some labeling in the gigantocellular (Gi) and parvocellular (PCRt) reticular formation. Insets, labeled neurons in the spinal trigeminal nucleus oralis (SpVo) and the lateral paragigantocellular nucleus (LPGi). This region of the brainstem contained extensive axon collaterals crossing the midline. (C–H) Labeling of other premotor neuron groups including: the deep cerebellar nuclei (DCN, C); the dorsal principal trigeminal sensory nucleus (dPrV, D); the motor trigeminal nucleus (MoV, primary infection) and surrounding trigeminal regions (collectively, PeriV) (E); the mesencephalic sensory nucleus (MesV), which extended from MoV to dorsal to the periaqueductal grey (PAG) (F); the dorsal midbrain reticular formation (dMRf, G); and the red nucleus (RN, H). Displayed side of the brainstem is indicated in each panel. Stereotaxic maps for this and all subsequent figures were obtained from the Allen Brain Institute website: www.brain-map.org.


