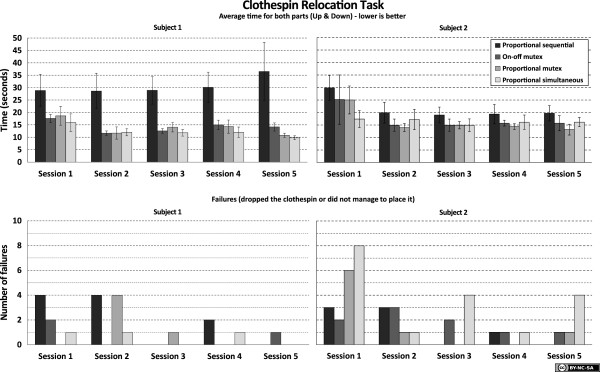
Figure 7.

Results for the Clothespin Relocation task. Two normally limbed subjects were used. The top charts show results from the Clothespin Relocation Task, where the time represents average time for moving a clothespin up and down (shorter time is better). The error bars show the standard deviation within the session. The bottom charts shows the number of failures/dropped items recorded during each session.
