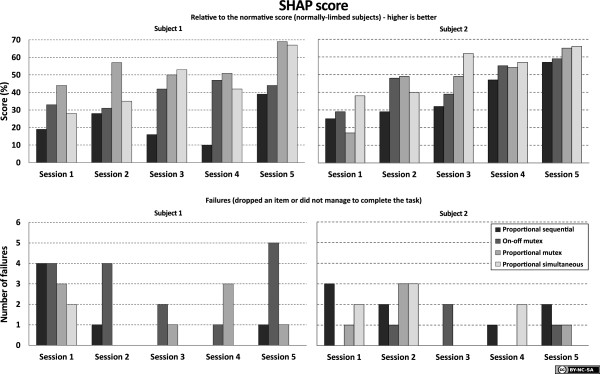
Figure 8.

Results from SHAP. Two normally limbed subjects were used. The top charts show the SHAP scores, where a higher score is better (100 is the score of the normal population). The bottom charts show the number of failures/dropped items recorded during each session.
