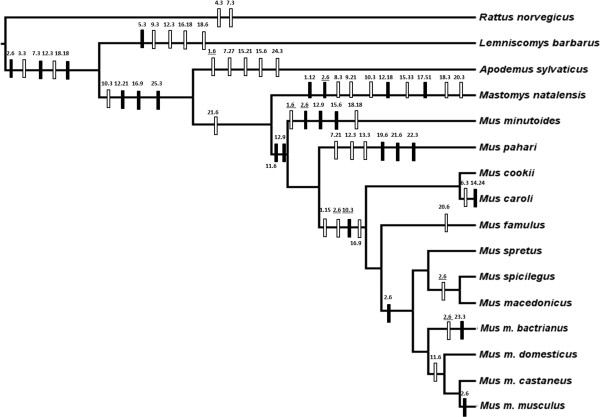
Figure 2.

Phylogeny of the 16 rodent species analyzed in this study. Parsimony-informative indels are mapped throughout the tree. Filled rectangles indicate insertions and open rectangles indicate deletions. Indels are labeled according to region within the CatSper1 sequence where indels were identified (see Additional file 2: Figure S1) followed by number of inserted/deleted nucleotides. Underlined labels indicate homoplasious indels.
