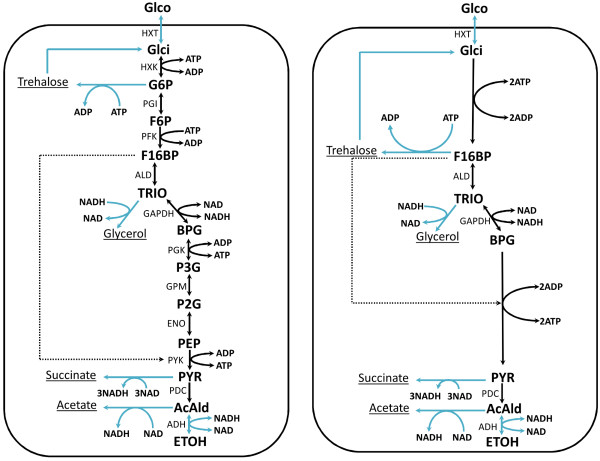
Figure 2.

Schematic of the original and reduced yeast-glycolysis networks. The left-hand panel is a schematic representation of the yeast glycolysis model used for model reduction. The full model description and an explanation of all the abbreviations is found in [26]. The right-hand panel represents the reduced model after deleting 5 complexes (F6P, P2G, P3G, G6P and PEP). The blue arrows in the two panels indicate external fluxes.
