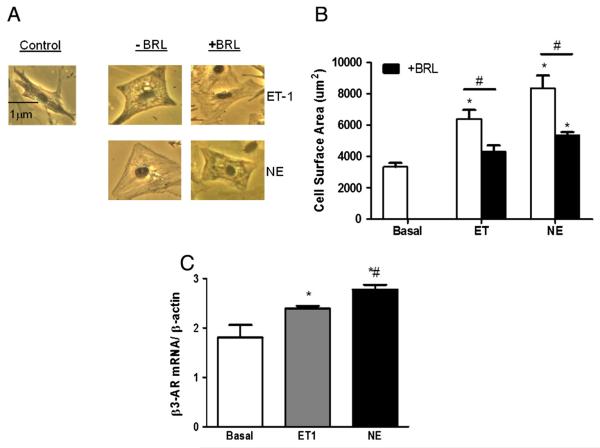
Fig. 1.
Norepinephrine and ET-1 induced hypertrophy and β3-AR expression in isolated NRVMs. Cells were treated with or without ET-1 (100 nM) for 48 h, and NE (100 mM) for 72 h. A–B.) Cell surface area was determined by phase contrast microscopy. C.) β3-AR mRNA expression was measured by qPCR, and normalized to baseline expression. *p < 0.05 vs. basal; #p < 0.05 vs. respective agonist control in immunostaining experiment; and #p < 0.05 vs. ET-1 in qPCR experiment.

