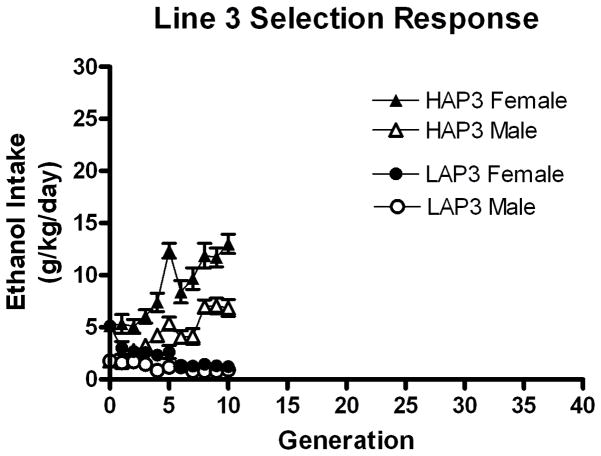
Figure 4.
Mean ethanol intakes in selected HAP3 (triangles) and LAP3 (circles) lines of mice show a robust response to bidirectional selection for high alcohol intake in a 24-hr access 2-bottle choice procedure. Females (filled) drank more than males (open), similar to experiment 1. Generations 0 (progenitor) through 10 (selected) are illustrated here.

