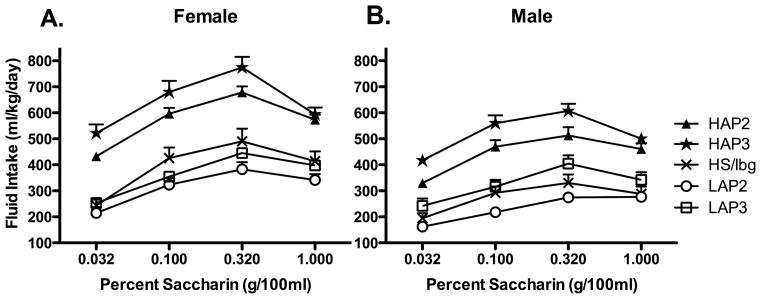
Figure 6.
Saccharin consumption in 4 selected lines and the non selected HS/Ibg mice. Alcohol preference generally predicted saccharin preference. A. Female mice: generally, selectively bred HAP lines drank more than LAP and HS/Ibg lines; LAP 2 mice drank less than HS/Ibg, while LAP 3 mice differed only from HAP3, not HS/Ibg. B. Male mice generally drank less than female mice, but broadly speaking, showed similar genetic differences in saccharin intake as female mice. Statistical tests are not illustrated here for figure clarity.

