
Figure 7.
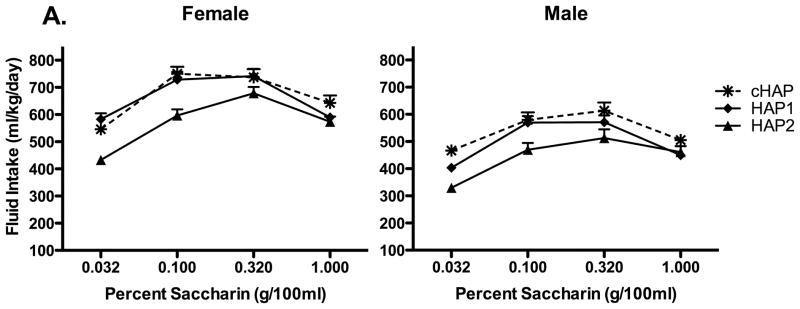
Saccharin consumption in the cHAP line and its progenitors, HAP 1 and HAP 2. Consistent with their higher intake of alcohol, cHAP mice drank more saccharin than HAP 1 mice at 0.032 and 1% saccharin, and more than HAP 2 at all concentrations tested. Again, female mice drank more overall than male mice.