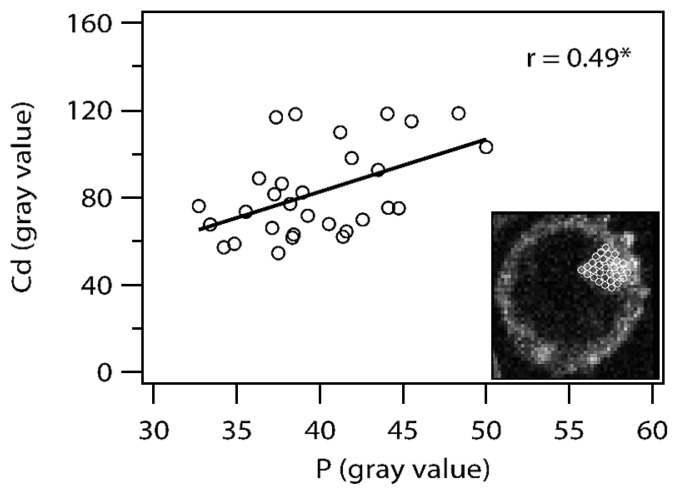
Fig. 6.
Correlation between gray scales of cadmium (Cd) examined by synchrotron radiation μ X-ray fluorescence and phosphorus (P) by energy dispersive X-ray fluorescence of SEM within a vacuole of an auxiliary cell of Gigaspora margarita. Thirty data sets of an average value within a circle (8 pixels in diam.) were obtained, where 30 circles were arranged in a single layer on an entire vacuole. Right lower image: an overlaid image of Cd distribution and an array of 30 circles on an entire vacuole. r, Pearson’s correlation coefficient; *, P < 0.01.

