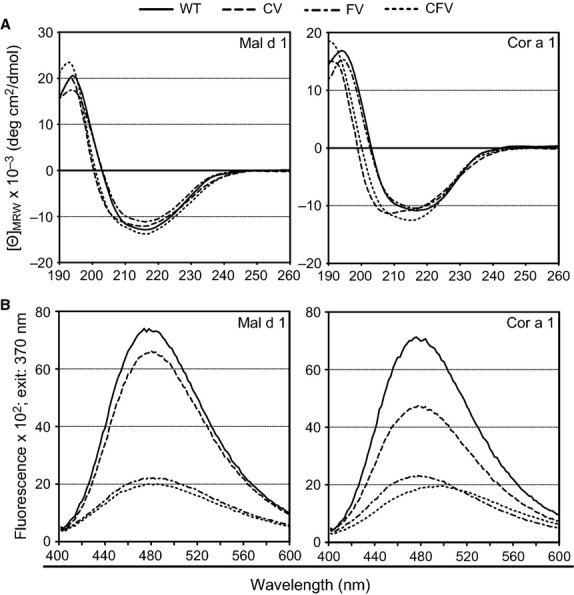
Figure 2.

Circular dichroism spectra of the structural variants compared with the respective WT proteins at 20°C. Data are baseline-subtracted, normalized, and presented as mean residue molar ellipticity [Θ]MRW (A). Fluorescence emission spectra of the structural variants compared with the respective WT proteins. Data are baseline-subtracted and presented in fluorescence units (B).
