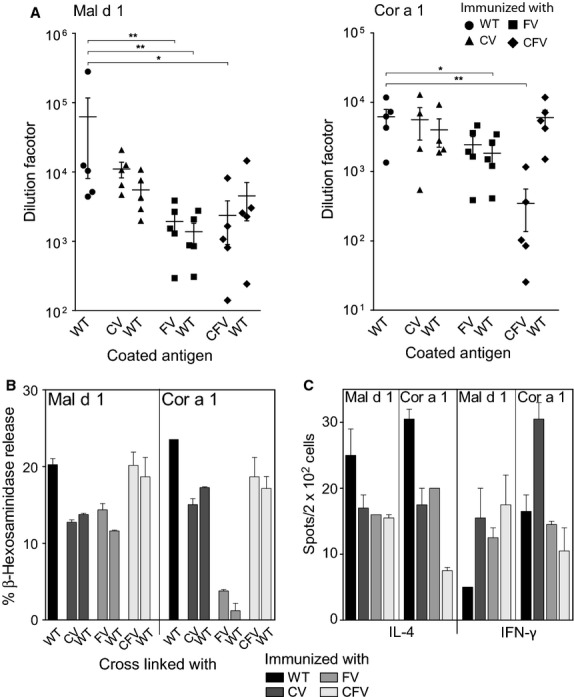
Figure 4.

IgG1 antibody responses at day 49 analyzed by ELISA. IgG1 levels of each variant against itself and the WT, compared with the IgG1 response of the respective WT protein. The y-axis shows Δ preserum values of the serum dilution at which 50% of the maximum absorption (405 nm) was measured. Each symbol represents sera from one of the five mice immunized with each protein (A). IgE antibody responses by mouse RBL assays. 1 : 40 dilutions of sera pools from mice immunized with each of the antigens were used to passively sensitize mouse RBL cells. Recognition and cross-linking of IgE antibodies was evaluated for the homologous molecules and the WT proteins. Data are expressed as means ± SEM of% mediator release (B). ELISPOT analysis of splenocytes from immunized mice expressed as the mean of cytokine-secreting cells per 2 × 10⁵ cells ± SEM (C). P-values were calculated using the Mann–Whitney U-test (*P <0.05; **P <0.01).
