
Figure 6.
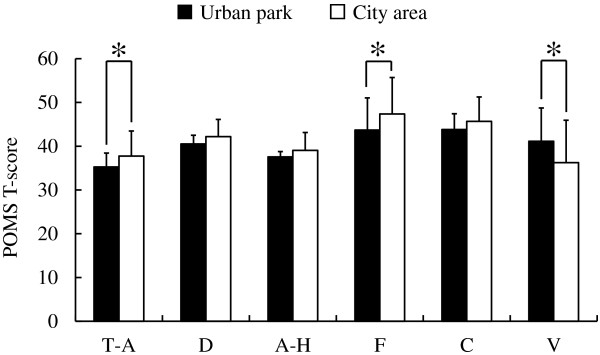
Comparison of subjective Profile of Mood State (POMS) scores between the two environments. T-A, tension-anxiety; D, depression; A-H, anger-hostility; F, fatigue; C, confusion; V, vigor. N = 17, mean ± standard deviation. *P < 0.05, determined by the Wilcoxon signed-rank test.