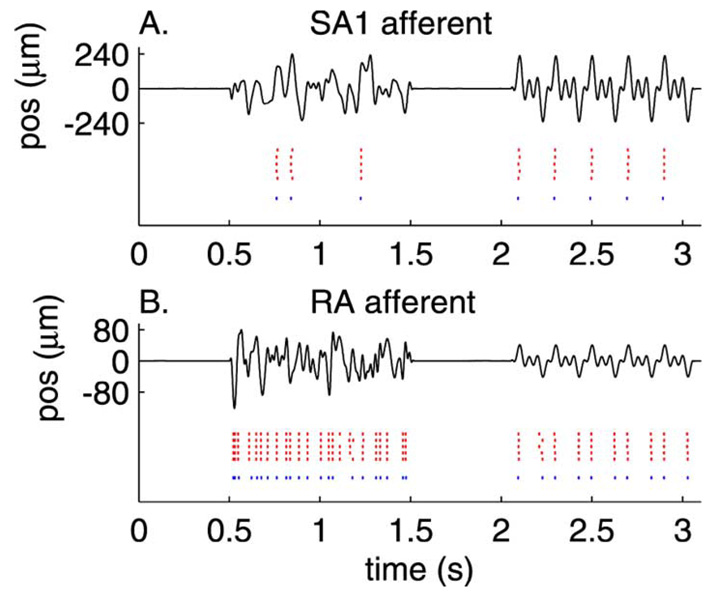
Fig. 4.
Measured and predicted spike trains evoked by two stimuli for (A) an SA1 and (B) an RA afferent (conventions as in Fig. 3). Parameters obtained from the training set were used to derive predictions to novel stimuli. Each row in the red raster plot shows the response evoked on each of five presentations of the stimulus. The blue raster plot shows the spike trains predicted by the model with parameters estimated by using the same stimuli.

