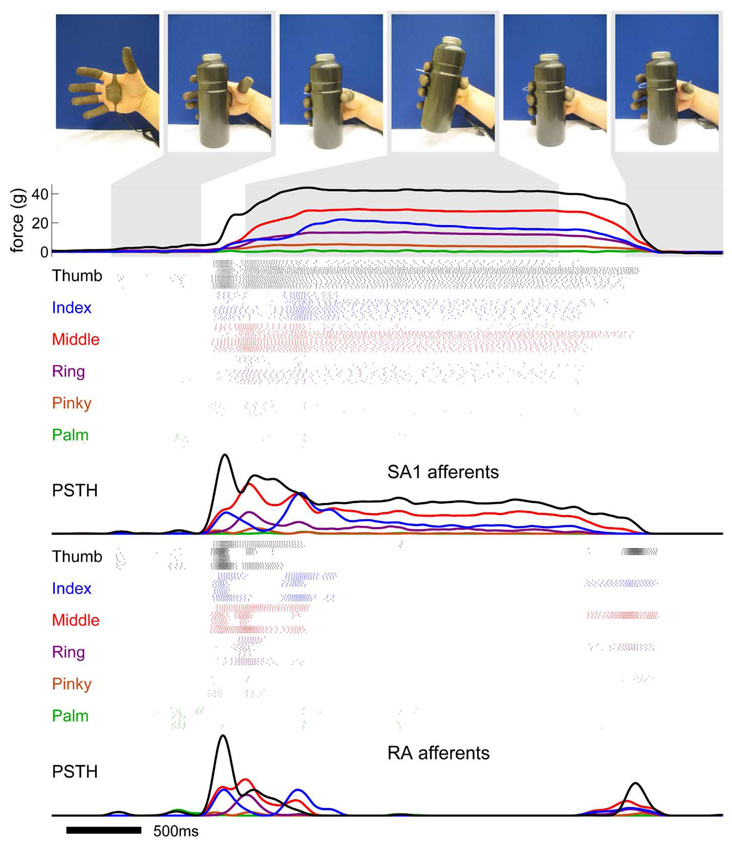
Fig. 6.
Illustration of the biofidelic approach to tactile feedback. A hand equipped with a sensorized glove grasps, picks up, and puts down a water bottle. Each colored trace shows the force exerted on a fingertip or on the palm as a function of time. The outputs of the force sensors on the digits and palm are used as inputs to five clones each of four SA1 and four RA afferents on each digit and on the palm, for a total of 240 simulated afferents. For the purposes of this simulation, we assumed that the force exerted on each digit was equally distributed across all of the stimulated receptors. The model is designed for more localized force sensors whose receptive fields are approximately the same size as that of mechanoreceptive afferents. Each group of colored rasters corresponds to the activity evoked in a population of afferents whose receptive fields are located on a single digit or on the palm (colors match those of the displacement traces). The peristimulus spike histograms are shown under the corresponding rasters showing the mean response across the population of SA1 and RA fibers. As can be seen from the figure, simulated SA1 and RA afferents produce qualitatively different responses during the manipulation of the bottle. SA1 afferents tend to respond throughout the contact period whereas RA afferents respond at the onset and offset of contact. Information about the location of contact on the hand, timing of contact, and force of contact are contained in the activity of the population of afferents.

