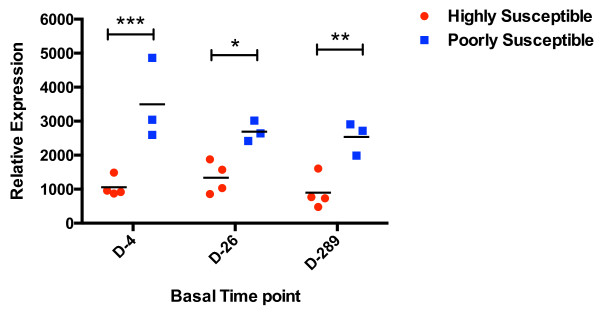
Figure 5.

Basal TRIM5α mRNA levels over time. Relative basal mRNA levels of TRIM5α was measured 4, 26–33, and 289–298 days prior to the first challenge and plotted for the highly susceptible (R700-R702, R704) and poorly susceptible animals (R697, R698, R705). Values for R703 were omitted due to lack of sample at all 3 time points. GeNorm analysis by the GenEx 6 MultiD software (TATA Biocenter, Sweden) chose TBP and βGus as the most stable genes and all gene expression values were normalized to them using the ΔCt method and the following formula: 1000 × 2-ΔCt. Significance was calculated by 2way ANOVA with Sidak’s multiple comparison test. Asterisks indicate significance at P < 0.05. The magnitude of the observed differences seen for TRIM5α is such that we have power >0.8 to state that these significant differences are genuine, based on determination of Cohen’s d as a measure of the Effect Size (ES) seen [55].
