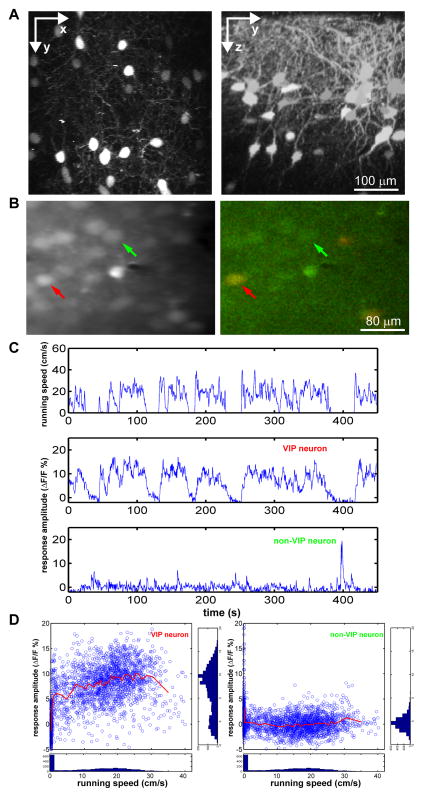
Figure 1.
Calcium imaging of VIP neurons in vivo in behaving mouse.
(A) Images in vivo of V1 in VIP-Cre::Ai14 mouse. Left panel shows projection along z-axis, and is a ‘top-down view’ of the brain showing the lateral distribution of VIP neurons. Right panel shows projection along x-axis, and is a ‘side view’ of the brain showing the distribution of VIP neurons across different cortical layers. (B) After loading OGB-1, images were taken at 800nm (green channel only, left panel) to image the calcium response, and at 910nm to visualize the TdTomato-expressing VIP neurons (right panel). Red arrows point to a VIP neuron; green arrows indicate a non-VIP neuron. (C) Example showing calcium responses of the VIP (middle) and non-VIP (bottom) neurons shown in (B) in relation to running speed (top). (D) The distribution of the calcium signal in relation to the running speed for each signal point of the traces in (C). The side panels show the count of signal points along corresponding axis. The red line is the average fluorescent value along the running axis smoothed with a 50-data point sliding window.

