
Figure 5.
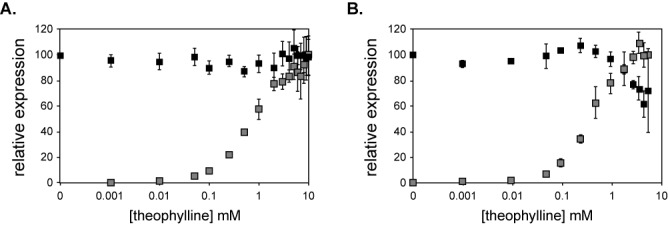
Dose response curves for luciferase reporters. (A) Dose–response curves for luciferase reporters expressed in intact E. coli cells. The gray squares correspond to the C riboswitch; the black squares correspond to a control lacking the aptamer. Data are normalized to the expression of either the C riboswitch in 10 mM theophylline or the control in 0 mM theophylline. Each data point represents the average of three independent measurements; error ± SD. (B) Dose–response curves for luciferase reporters expressed from DNA templates expressed in E. coli S30 extract. The gray squares correspond to the C riboswitch; the black squares correspond to a control lacking the aptamer. Data are normalized to the expression of either the C riboswitch in 6 mM theophylline or the control in 0 mM theophylline. The dose–response curve was terminated at 6 mM theophylline in extract because of the increasing toxicity of the ligand, as seen with the control dose response (black squares). Each data point represents the average of three independent measurements; error ± SD.