
Figure 4.
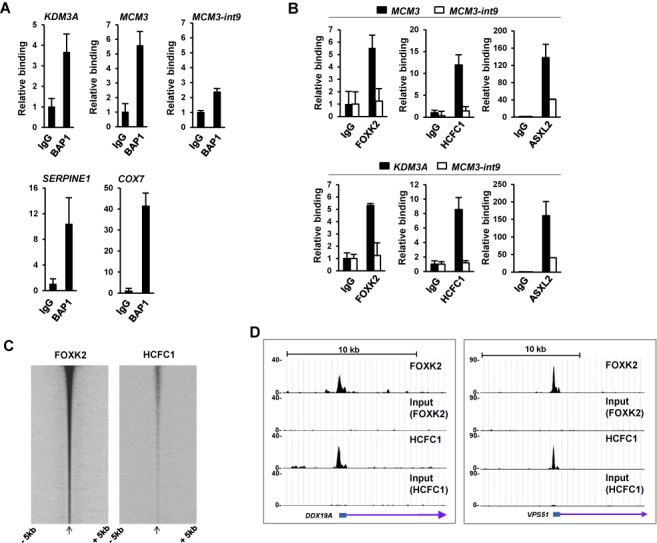
FOXK2 and the PR-DUB bind to the same chromatin regions. ChIP-qPCR analysis of endogenous BAP1 (A) and the other PR-DUB components HCFC1 and ASXL2 (B) binding to the indicated FOXK2 genomic binding regions. Blacks bars in (B) represent binding to FOXK2 binding regions associated with the MCM3 and KDM3A loci; white bars are negative control region which does not bind to FOXK2 (MCM3-int9). Data are normalized against input DNA and shown relative to binding to non-specific IgG (taken as 1). Data are the average of three independent experiments. (C) Genome wide correlation between FOXK2 and HCFC1 (23) binding regions. Heatmap of HCFC1 and FOXK2 read densities mapped onto FOXK2 peak summits and ranked according to FOXK2 signal. (D) UCSC genome browser view of FOXK2 and HCFC1 binding profiles associated with the DDX19A and VPS51 loci.