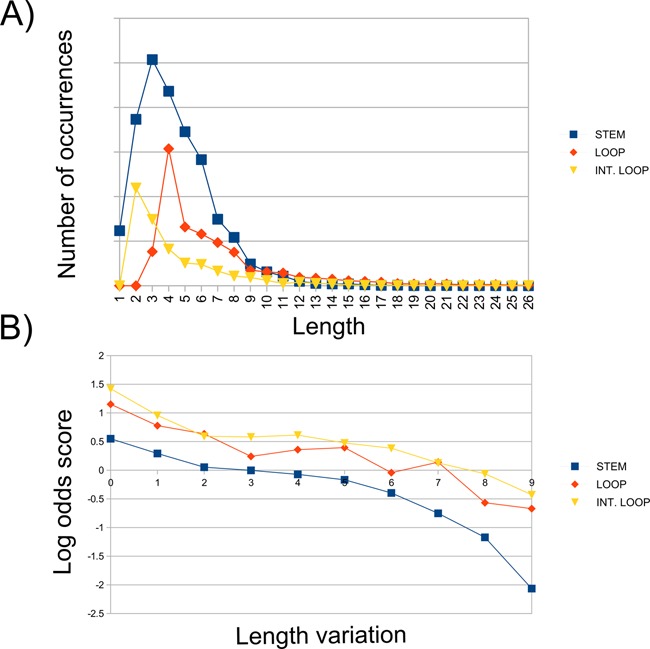
Figure 2.

(A) Length distribution of stems, loops and internal loops detected in Rfam. (B) Inverse correlation between length variation and log-odds score. For each Rfam RNA, we extracted the length of stems, loops and interior loops, counted the number of transitions from an RNA sub-structure to another of the same type but with different length for each aligned RNA sequence pair in Rfam (e.g. from a stem of length 1 to a stem of length 2, from a stem of length 1 to a stem of length 3 and so on for all possible combinations) and grouped together transitions having the same length difference (e.g. transitions from a stem of length 1 to a stem of length 3, from a stem of length 2 to a stem of length 4, from a strand of length 3 to a strand of length 5 and so on were collected together in the same group containing all transitions of size 2). The frequency of each transition group was then computed as log-odd scores. The three distributions in the figure show the log-odds scores for any variation in size for stems (blue curve), loops (red) and internal loops (yellow), respectively, and highlight an inverse relationship between the length variation in each class of SSEs and its frequency in the data set of RNA alignments.
