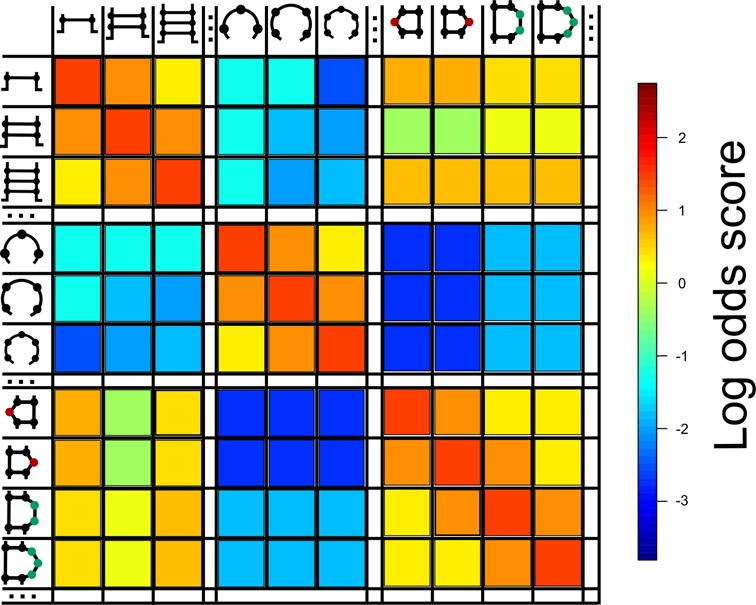
Figure 4.

Graphical representation of the MBR. This figure shows a subset of rows/columns of the MBR matrix, using a color-coding to show substitution rate patterns: color scale represents log-odds scores from lower (blue) to higher (red). Rows and columns are elements of RNA secondary structure of different length and every cell stores the log-odds value for the substitution of one element with another element. The cells in the principal diagonal always have the highest value in the respective row and column. Substitutions between elements belonging to the same group (i.e. stems, loops and interior loops) display higher log-odds values than substitutions between elements belonging to different groups. The ‘…’ notation indicates that some rows/columns were omitted from the graphical matrix representation.
