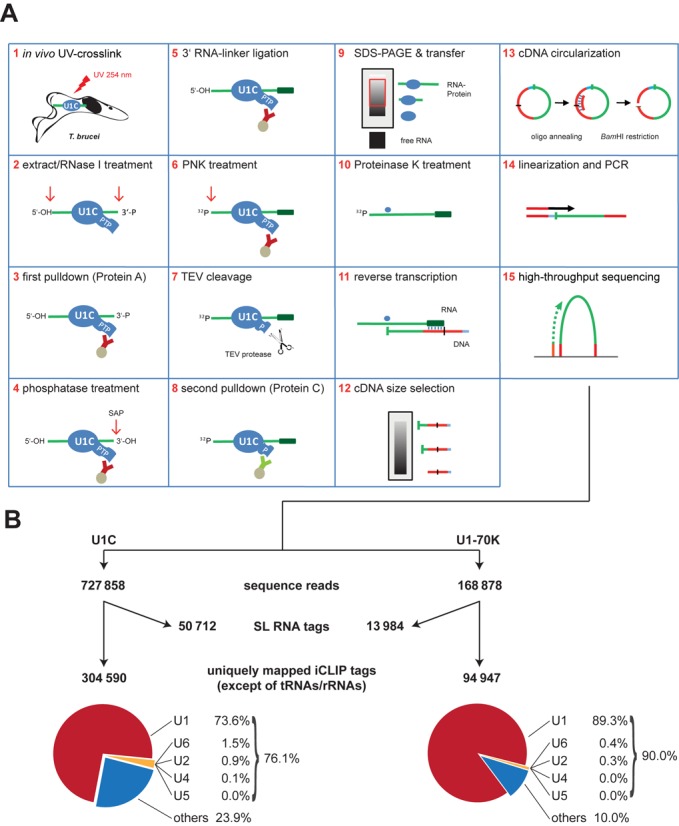
Figure 2.

Genome-wide mapping of U1C and U1-70K RNA–protein interactions in trypanosomes by iCLIP-Seq: strategy and statistics. (A) Schematic overview of the iCLIP-Seq approach, as adapted for Trypanosoma brucei cell lines stably expressing PTP-tagged RNA-binding proteins (here: U1C). For a detailed description, see ‘Results’ section. (B) Summary of distribution of U1C and U1-70K iCLIP tags. The numbers of sequence reads, of uniquely mapped reads for the Tb427 genome and of the separately aligned SL RNA tags represent the sum of three (U1C) or two (U1-70K) biological replicates (for the numbers of the individual experiments, see Supplementary Figure S1). The pie charts show the distribution of uniquely mapped reads in snRNAs (U1, U2, U4, U5 and U6) and genomic regions other than snRNA and SL RNA loci (‘others’).
