Figure 3.

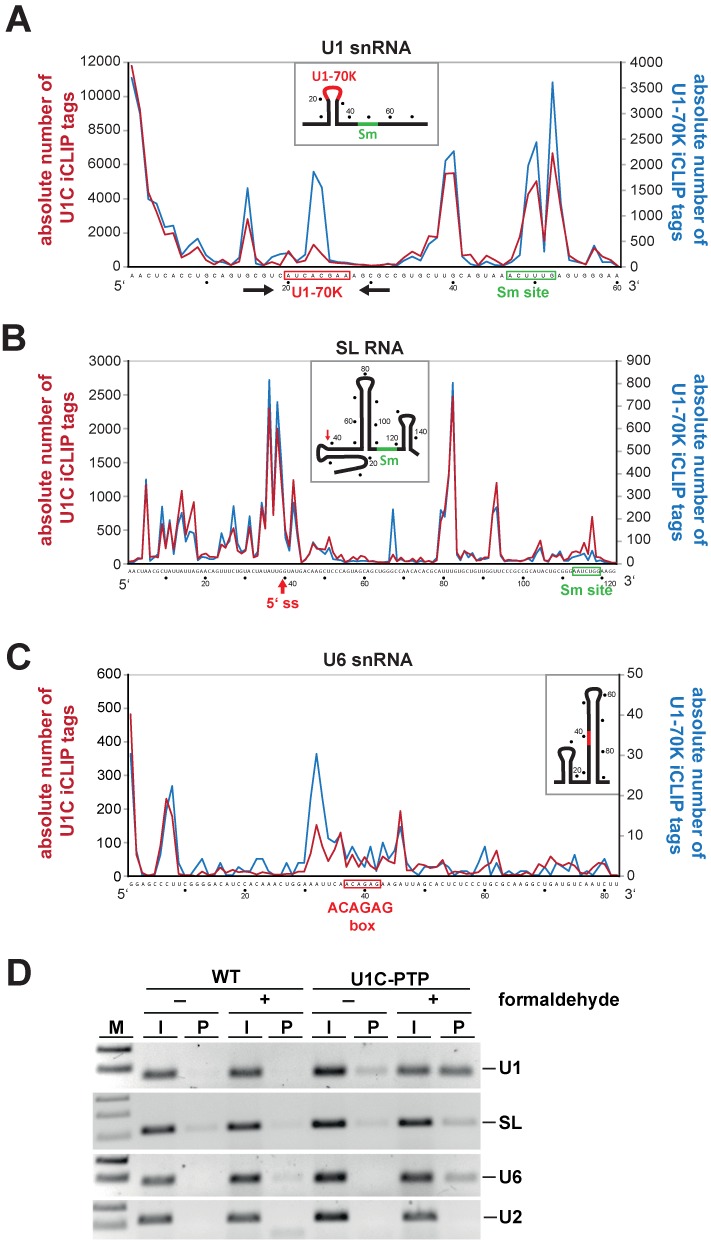
Crosslink site profiles of Trypanosoma brucei U1C and U1-70K on the U1, SL and U6 snRNAs. (A–C) The numbers of random-barcode-filtered iCLIP tag counts for U1C (red line) and U1-70K (blue line) iCLIP tags (crosslink sites) on the U1, SL and U6 snRNAs are plotted in single-nucleotide resolution. Only truncated versions of the entire RNA sequences without the last 15 nucleotides are shown (U1 snRNA: nucleotides 1–60; SL RNA: 1–123; U6 snRNA: 1–82), since for technical reasons iCLIP tags further 3′ cannot be mapped. Schematic models of the secondary structures are depicted for each RNA. (A) iCLIP profiles on the U1 snRNA. The U1-70K (red) and the Sm binding sites (green) are boxed, the stem-loop structure is indicated by arrows. (B) iCLIP profiles on the SL RNA. The 5′ splice site (5′ss; after position 39) is highlighted by a red arrow, the Sm site boxed in green. (C) iCLIP profiles on the U6 snRNA. The highly conserved ACAGAG hexanucleotide, which interacts with the 5′ splice site, is boxed in red. (D) Validations of U1C iCLIP tags for the U1, SL and U6 snRNAs. Cell extracts were prepared from T. brucei wild-type (WT) cells and a cell line stably expressing PTP-tagged U1C, without (−) and with (+) prior crosslinking by formaldehyde. Extracts were subjected to IgG pulldown of PTP-tagged complexes, followed by crosslink reversal. Copurifying U1, SL and U6 snRNAs (as indicated on the right) were detected by RT-PCR (lanes P). For comparison, 1% of the total input is shown (lanes I). M, markers (100 and 200 bp; for panel SL: 100, 200 and 300 bp).
