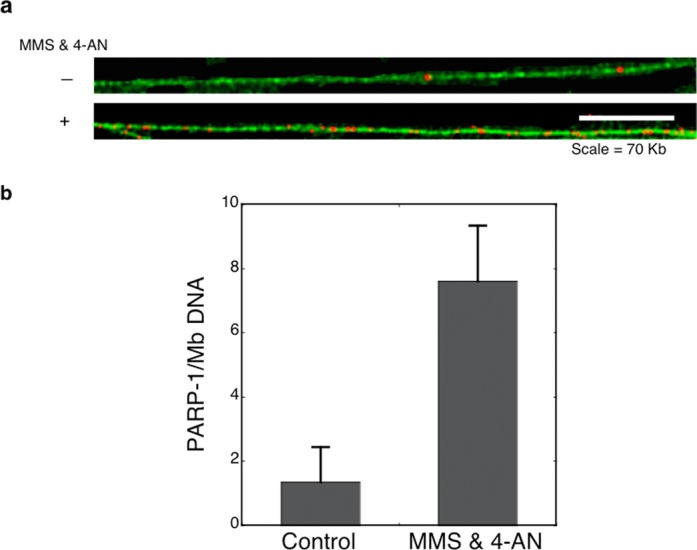
Figure 8.

DNA fiber-spread analysis of PARP-1 covalently attached to genomic DNA. Shown is detection and enumeration of PARP-1 immunostaining in DNA fiber spreads isolated from either control untreated PARP-1+/+ cells or cells treated with the MMS and 4-AN combination. (a) Representative images of DNA fiber stained with YOYO-1 green fluorescent dye. PARP-1 sites were detected with anti-PARP-1 antibody followed by secondary and tertiary antibodies that were labeled with red fluorescence. Scale bar = 70 Kb. (b) Number of PARP-1 sites per Mb (106 nts) as determined fiber-spread analysis for cells under normal culture conditions and after exposure to MMS and 4-AN. Fiber analysis values were determined from analysis of two repeat experiments and from two different slides for each repeat. At least 200 Mb were analyzed per experimental condition. Error bars represent standard error of the mean.
