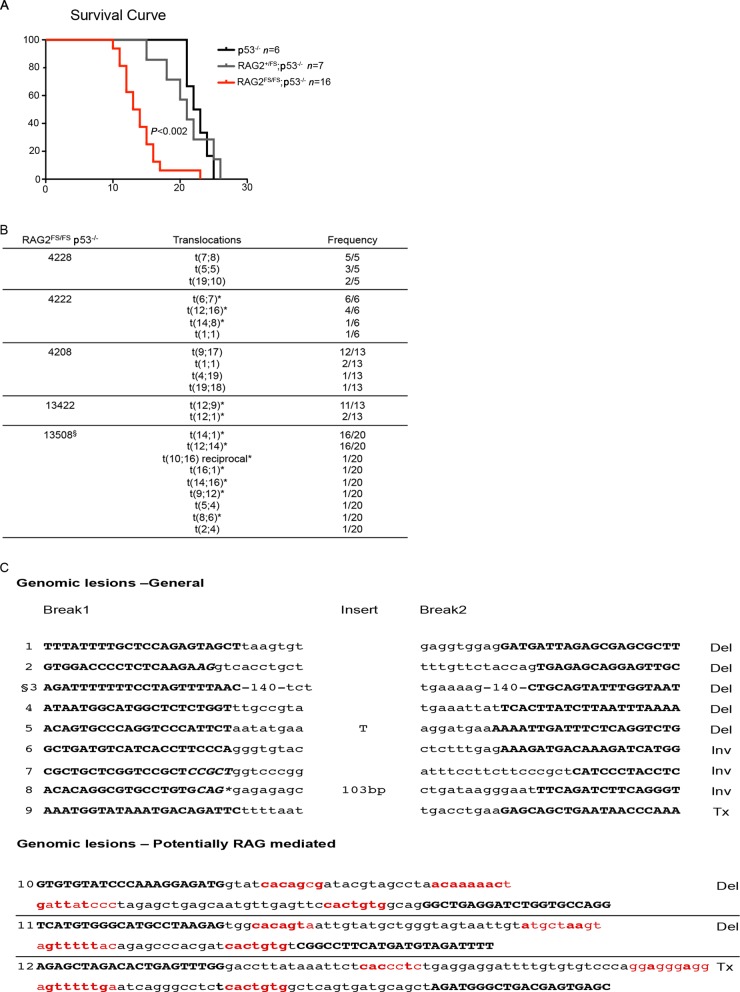
Figure 3.
RAG2FS/FS;p53−/− mice develop rapid lymphoma with genomic instability. (A) Kaplan–Meier survival curve of the indicated genotyped. P versus p53−/− mice. (B) SKY analysis of RAG2FS/FS;p53−/− T cell lymphomas. * indicates antigen receptor chromosome. (C) Genomic lesions from RAG2FS/FS;p53−/− tumor 13422. The lesions are divided into two groups: General and potential V(D)J mediated. Bold capital letters represent the junction sequence; small letters represent the reference genome at the break points, bold italic letters are microhomologies, red small letters are the cRSSs with bold red representing matches to consensus RSS. Configuration of lesions are indicated to the right; Del, deletion; Inv, inversion; Tx, translocation. §140 bp homology at the junction. *cagcaccacaaacaggacctagtcccgcactgcttggcgataactgcctagctacagggctaggtgctctttggatgcacatgcgcttcactgcacaaaatca.

