
Figure 1.
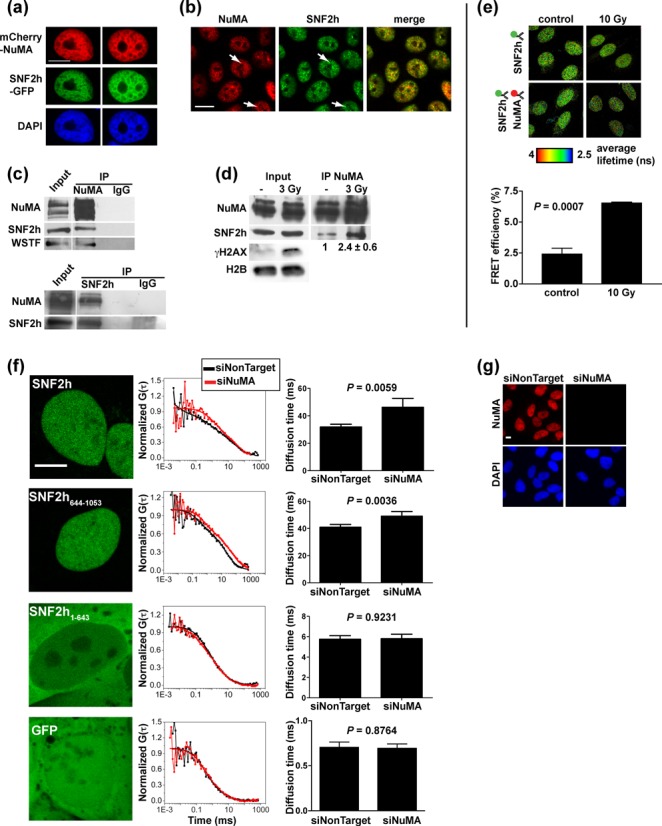
NuMA interacts with SNF2h. (a) Confocal images of SNF2h-GFP and mCherry-NuMA transiently coexpressed in non-neoplastic HMT-3522 S1 cells. The nuclei were counterstained with DAPI. (b) Colocalization of NuMA and SNF2h analyzed by immunostaining in S1 cells. Arrows indicate colocalized foci. (c) IP of NuMA and SNF2h from S1 nuclear extracts. Nonspecific immunoglobulins (IgGs) were used as controls. The western blots were probed for NuMA, SNF2h and WSTF. (d) NuMA IP from nuclear extracts of malignant HMT-3522 T4-2 cells either mock irradiated or exposed to 3 Gy of gamma radiations and left to recover for 30 min. SNF2h signal intensity in IP samples was quantified by densitometry and averaged (n = 4, bottom of IP panel). DNA damage induction was verified by probing the input samples for γH2AX; H2B was used as loading control. (e) FRET measured in nonirradiated (control) and irradiated (10 Gy) U2OS cells using fluorescence lifetime imaging. SNF2h was stained with antibodies coupled to Alexa Fluor® 488 (FRET donor) and NuMA with Alexa Fluor® 555-conjugated antibodies (FRET acceptor). Donor fluorescence lifetime was measured in the absence or presence of acceptor and used to calculate FRET efficiencies. Representative fluorescence lifetime images of the donor are shown. The bar graph represents means ± SEM FRET efficiencies (n = 3 experiments; ≥ 25 cells/conditions in each experiment). (f) Diffusion of GFP-tagged SNF2h measured by fluorescence correlation spectroscopy in U2OS cells. SNF2h fragments (C-terminal a.a. 644–1053 and N-terminal a.a. 1–643) and GFP alone are used as controls. Cells transfected with NuMA-targeting siRNA (siNuMA) are compared to cells transfected with nontargeting siRNAs (siNonTarget). Representative confocal images (left) and FCS curves (middle) are shown. Diffusion times are represented in the graphs as mean ± SEM (n ≥ 20 cells from at least two biological replicates). (g) NuMA silencing verified by immunostaining. Scale bars, 10 μm.